Introduction
After nearly four decades of a consistently downward trend, the consumer price index (CPI) in 2021 increased at the fastest rate since 1982, marking a clear reversal of the previous trend.[1] Although various economic disruptions related to the Covid-19 pandemic have contributed to rising inflation, there are other factors involved, most notably monetary policy.
Beginning with the 2007-2009 global financial crisis, and continuing with the Covid-19 pandemic through the end of 2021, the Federal Reserve (Fed) has aggressively pursued a policy of “quantitative easing” by purchasing nearly $9 trillion of U.S. Treasury securities and mortgage-backed securities.[2] Although this policy had its intended effect of providing financial market liquidity, lowering interest rates, increasing business and consumer loans, and preventing a more severe economic downturn, it now poses a challenge to the Fed – how to curb rising inflation without causing a recession.
This issue brief will examine the relationship between money, inflation, interest rates, and the economy; and consider why the Fed may – or may not – successfully unwind its new policy of quantitative easing; and explain how all of this could affect the federal budget.
The Federal Budget and the Economy
Current economic conditions affect the federal budget in numerous ways, some more obvious than others. A growing economy generates additional revenue through increased employment, wages, and profits, but also reduces spending on programs like unemployment insurance and supplemental nutrition assistance, thereby reducing the deficit. When there is an economic recession, the opposite result occurs.[3]
Higher inflation increases both revenue and programmatic spending by nearly equal amounts, resulting in roughly offsetting effects on the deficit (see Figure 1). Additional revenue results from higher taxable income, augmented by indexing the tax code to a measure of inflation that increases more slowly than the traditional measure.[4] Additional spending results from higher cost-of-living adjustments for programs like Social Security, and increased eligibility for means-tested programs like Medicaid, when inflation rises faster than the income of the poor.[5]
Higher inflation also results in higher interest rates which increases the cost of federal borrowing. The magnitude and timing of the additional cost depends on the maturity distribution of outstanding debt, the difference between short-term and long-term interest rates, and the maturity distribution of newly issued debt.
Figure 1 shows the budgetary effects of a one percentage point increase in the annual inflation rate from 2021 through 2031, relative to the Congressional Budget Office’s (CBO) February 2021 baseline assumptions (3.1% vs 2.1%).[6]
Figure 1: Budgetary Effects of One Percentage Point Increase in the Inflation Rate (2021-2031)

CBO’s alternative assumptions only consider increases in the inflation rate up to one percentage point. But given the projected size of the publicly held federal debt, every percentage point increase would eventually add between $230 billion (2022) and $350 billion (2031) in annual interest costs.[7] The greatest inflationary risk to the federal budget is higher interest costs and accumulating debt, and monetary policy contributes to this risk.
Money, Inflation, and Interest Rates
When the supply of money increases faster than the supply of goods and services, the result is higher prices. Thus, inflation is often described as “too much money chasing too few goods.” Inflation can also result in higher interest rates. This result is known as the “Fisher effect,” named after economist Irving Fisher, who identified the positive relationship between inflation and interest rates, whereby higher (or lower) inflation corresponds to higher (or lower) interest rates.[8] But it’s important to distinguish between short-run and long-run effects.
When the Federal Reserve (Fed) lowers interest rates, banks respond by making more loans and creating more deposits, which expands the money supply.[9] Thus, more money corresponds to lower interest rates as the Fed pursues a looser monetary policy to stimulate the economy. But if interest rates stay too low for too long, the result is higher inflation due to excess demand for goods and services purchased with cheap credit. Rising inflation causes interest rates to rise, and banks to make fewer loans and create fewer deposits, which contracts the money supply. Thus, less money corresponds to higher interest rates as the Fed pursues a tighter monetary policy to fight inflation.
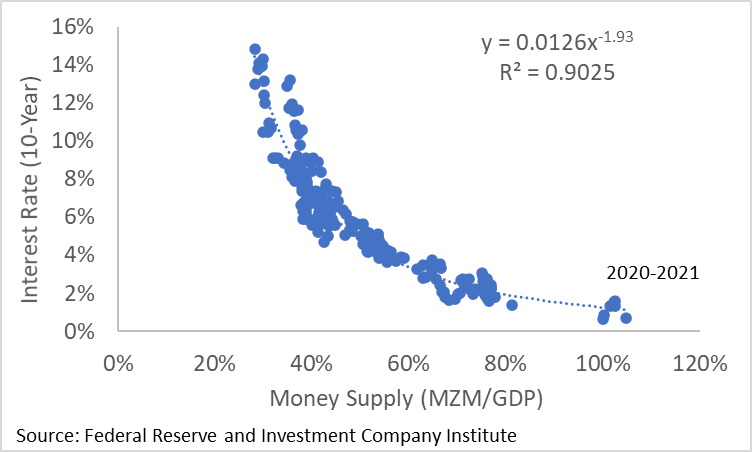
Figure 2 shows the correlation between the money supply, measured as a percentage of the economy (GDP), and the interest rate on U.S. Treasury securities with a constant maturity of 10-years.[10] The money supply is defined as money of zero maturity (MZM) which includes all deposits that can be redeemed upon demand at face value.[11]
Figure 2: Money Supply and Interest Rates (1959-2021)
How the Fed Fights Inflation
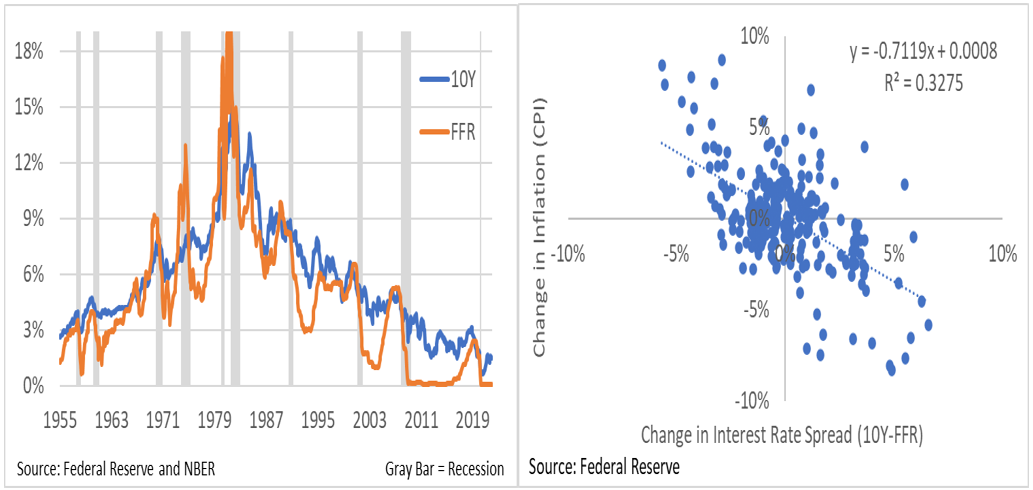
When the Fed seeks to fight inflation, it raises the short-term Federal Funds Rate (FFR) relative to other long-term interest rates. This is known as flattening the “yield curve.” The FFR is the interest rate banks charge each other for overnight loans. The left side of Figure 3 shows the 10-year Treasury rate and the FFR from 1959 through 2021.[12] Although both rates are positively correlated with inflation, the difference between the two rates (10-year rate minus FFR) which is known at the “interest rate spread,” is negatively correlated, as shown in the right side of Figure 3.[13]
The Fed reduces the interest rate spread by increasing the FFR relative to the 10-year rate to fight inflation; and the Fed increases the interest rate spread by reducing the FFR relative to the 10-year rate once it believes inflation has been contained.
Figure 3: 10-Year Rate vs FFR and Interest Rate Spread vs Inflation (1955-2021)
The Boom-Bust Cycle
The Fed’s monetary policy not only affects money, inflation, and interest rates, but it also affects employment. Indeed, critics often complain the Fed causes alternating cycles of economic booms and busts. First, the Fed reduces the FFR to increase the availability of credit and reduce the cost of borrowing, which increases employment and inflation. Then the Fed increases the FFR to reduce the availability of credit and increase the cost of borrowing, which reduces employment and inflation.
Historically, previous recessions have been preceded by an inverted yield curve (i.e., short-term rates higher than long-term rates).[14] Thus, the Fed’s efforts to fight inflation by increasing the FFR could result in a recession, which would also have negative budgetary effects.
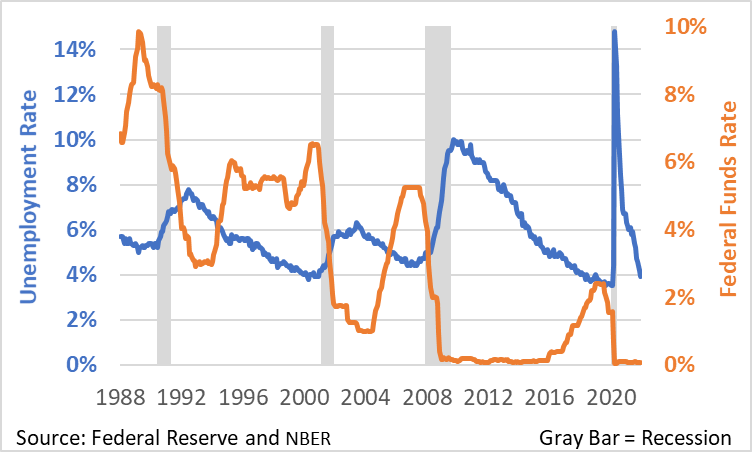
Figure 4 shows how the Fed has previously adjusted the FFR (orange line) in response to changes in the unemployment rate (blue line). As unemployment rises (or falls), the FFR decreases (or increases). Since 2008, the Fed’s ability to reduce unemployment has been limited by the fact that the FFR cannot go below zero. This limitation led to a major change in the Fed’s approach to conducting monetary policy.
Figure 4: Unemployment Rate and Federal Funds Rate (1986-2021)
From Open-Market Operations to Quantitative Easing
In 1977, the Federal Reserve Act was amended to establish three goals of monetary policy: maximum employment, price stability, and moderate long-term interest rates.[15] These goals are often referred to as the “dual-mandate” because it is generally assumed the third goal will be achieved by accomplishing the first and second goals. The Fed pursues these goals by increasing or decreasing interest rates based on various assumptions about the relationship between employment and inflation.[16]
In previous years, the Fed primarily used its policy of open-market operations to adjust the Federal Funds Rate (FFR), which is the interest rate banks charge each other for overnight loans. Under this policy, the Fed buys (or sells) financial assets (typically Treasury securities) from banks, and then credits (or debits) their “cash” reserves, which are held in the form of electronic deposits at the Fed, and redeemable upon demand for currency (i.e., Federal Reserve Notes). These purchases (or sales) can expand (or contract) the money supply, and thereby decrease (or increase) the FFR.
In response to the global financial crisis (2007-2009) and the subsequent housing bust, the Fed used its open-market policy to reduce the FFR to virtually zero, which is the effective lower bound of this policy.[17] To provide further economic stimulus and support the housing market directly, the Fed provided short-term loans to financially troubled institutions (both banks and non-banks) and purchased massive quantities of Treasury securities and mortgage-backed securities – i.e., quantitative easing.
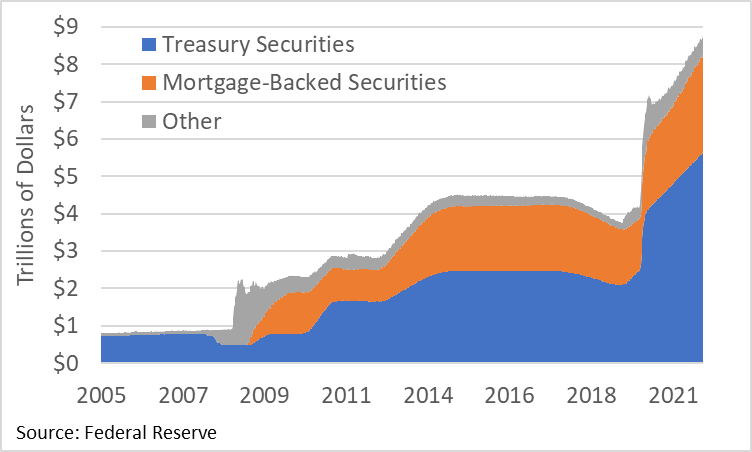
The Fed increased these non-traditional asset purchases through 2014, accumulating nearly $4.5 trillion on its balance sheet. The Fed was in the process of gradually reducing its balance sheet when the Covid-19 pandemic began. The Fed reacted swiftly by resuming its asset purchases, amassing nearly $9 trillion by the end of 2021. In response to these purchases, many critics of quantitative easing predicted rising inflation, which nevertheless remained subdued until mid-2021.
Figure 5: Federal Reserve Asset Purchases Under Quantitative Easing (2005-2021)
Following the introduction of quantitative easing, it was generally assumed the Fed had an exit strategy to unwind its purchases and normalize its balance sheet by selling securities or not replacing maturing securities with newly issued ones. But recent publications by Federal Reserve staff suggest “ample reserves” are the new normal.[18] Thus, it’s unclear when the Fed will reduce its balance sheet, and by how much.
Interest on Reserves and Repurchase Agreements
To overcome the zero lower bound and address the global financial crisis, the Fed was also given another monetary policy tool. In 2008, the Fed was authorized to pay interest on bank reserves.[19] Now the Fed can adjust the FFR by changing the interest rate paid on reserves, rather than just changing the amount of reserves.[20]
Under its previous open-market policy, the Fed would increase the FFR by selling a portion of its securities, which reduces the amount of reserves that banks have on deposit with the Fed, thereby discouraging additional bank loans. Under its new quantitative easing policy, the Fed can now increase the FFR by increasing the interest rate on bank reserves, which temporarily limits their availability, thereby discouraging additional bank loans.[21]
If the Fed raises the interest rate on reserves above the FFR, banks can earn more by leaving their reserves on deposit with the Fed than they can by lending them to other banks. Thus, the FFR must increase by an equal or greater amount to encourage banks to continue lending their reserves in the overnight market, rather than keeping them on deposit with the Fed.
Non-bank institutions like money market funds and government-sponsored enterprises (GSEs) like Fannie Mae, Freddie Mac, and Ginnie Mae also buy (or sell) securities from (or to) the Fed. But they do not have cash reserves at the Fed that earn interest.[22] To adjust interest rates on non-bank transactions, the Fed engages in repurchase (or reverse repurchase) agreements.[23] Under these agreements, the Fed buys (or sells) securities with an agreement to sell (or buy) the same securities at a different price at a specific date in the future (often the next day). The difference between the sale price and the purchase price reflects the implicit interest rate paid on the transaction.
By paying explicit and implicit interest on reserves and repurchase agreements, respectively, the Fed can establish a floor under the FFR and other short-term interest rates because financial institutions would be highly unlikely to accept an interest rate appreciably below what they could otherwise receive from the Fed. The ability to establish a floor is useful when interest rates are falling, and the goal is to avoid the zero lower bound. But paying interest on reserves creates a budgetary risk when interest rates are rising, and the goal is to fight inflation and avoid even higher interest rates.
Interest on Reserves and the Federal Budget
Given the relationship between money, inflation, and interest rates, the Fed’s policy of paying interest on bank reserves raises concerns about its potential impact on the federal budget.
Historically, the Fed has returned the interest earned on its assets to the U.S. Treasury, after deducting the cost of its operating expenses. As its assets have grown in recent years, the amount returned has grown from roughly $25 billion to more than $100 billion per year.[24] However, the Fed’s new policy of paying interest on reserves has created an additional expense. Figure 6 shows the Fed’s annual income, primarily interest earned, and annual expenses which since 2008 are increasingly due to interest paid.[25]
Figure 6: Federal Reserve Income, Expenses, and Payments to Treasury (2005-2020)
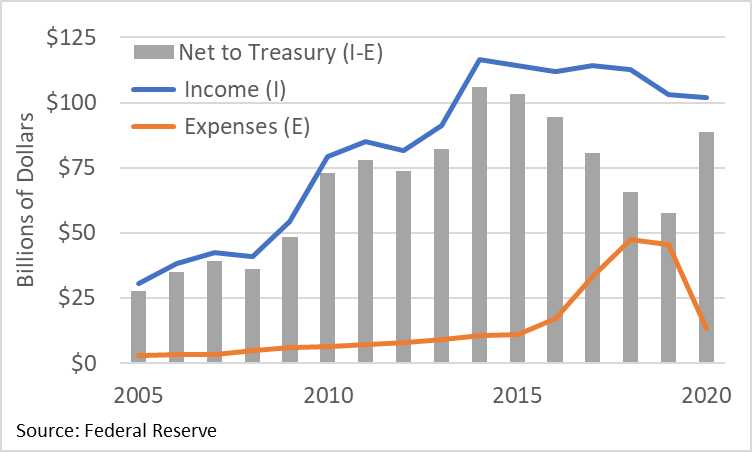
Although interest earned currently exceeds interest paid, that could change if inflation continues to rise. At the end of 2021, the average interest rate earned on the Fed’s securities was roughly 2.2% and the interest rate paid on bank reserves was 0.15%.[26] The primary reason for this difference is the Fed’s securities include maturities ranging from one day to 30 years.[27] Securities with longer maturities typically pay higher interest rates due to the “term premium,” which reflects their additional investment risk relative to securities with shorter maturities.[28]
Figure 7: Maturity Distribution of Fed Assets in Trillions of Dollars (December 2021)

One way to estimate the potential short-term budget impact of the Fed’s new policy is to assume the FFR and the 10-year rate will both initially rise to equal the inflation rate, meaning the yield curve would flatten. Under this assumption, interest paid on bank reserves will rise much faster than the interest earned on the Fed’s securities due to their longer maturities. To balance income and expenses, the Fed must either wait for its longer-term securities to reach maturity and be replaced with newly issued securities that pay the higher interest rate, or it must sell longer-term securities at a loss.[29]
To illustrate the potential shortfall between income and expenses, Figure 8 shows the cost of paying interest on reserves (IOR) at various rates relative to the current amount of income earned on the Fed’s securities.[30] In the short-term, a 1% IOR would result in the Fed paying $127 billion to the Treasury, whereas a 5% IOR would result in the Fed owing $113 billion to the Treasury. In the event expenses exceed income, the Fed would record the shortfall as a “deferred asset” to reflect the reduction in future payments to the Treasury needed to offset the shortfall.[31]
The longer-term impact depends on the path of future interest rates. If short-term rates rise above long-term rates (inverted yield curve), then any potential shortfall could be larger. If short-term rates remain below long-term rates (normal yield curve), then any potential shortfall would be eliminated over time.
Figure 8: Potential Cost of Paying Interest on Bank Reserves in Billions of Dollars

Instead of waiting for its securities to mature, the Fed could sell a portion of its existing securities to raise additional funds. But given higher interest rates, these sales would generate substantial losses, leaving the Fed technically insolvent because its liabilities (currency and bank reserves) would exceed the par value of its remaining assets (Treasury securities and mortgage-backed securities).
Conclusion
The rising level of inflation raises concerns about the budgetary and economic impact of the Fed’s new policy of massive asset purchases and paying interest on bank reserves. This policy, which was implemented and expanded during both a financial crisis and a public health crisis, was focused on providing monetary stimulus when the FFR was constrained by the zero lower bound. This policy was effective in preventing more severe economic downturns when inflation was low, and some observers were even worried about deflation. But it remains to be seen whether this policy will be equally effective when inflation is rising. Only time will tell.
[1] CPI Home: U.S. Bureau of Labor Statistics (bls.gov)
[2] Federal Reserve Banks | (stlouisfed.org)
[3] How CBO Estimates Automatic Stabilizers: Working Paper 2015-07 | Congressional Budget Office
[5] Biggest COLA Since 1982 (Just Barely) | Concord Coalition
[7] Assuming both short-term and long-term interest rates increase the same amount, and all outstanding debt is rolled-over and refinanced at the higher rates.
[8] real interest rate + inflation rate = nominal interest rate
[9] Bank of England Quarterly Bulletin 2014 Q1
[10] Money Stock Measures (H.6), Discontinues Money Zero Maturity | (stlouisfed.org); Money Market Fund Assets | (ici.org); Market Yield on U.S. Treasury Securities at 10-Year Constant Maturity (GS10) | (stlouisfed.org)
[11] MZM: A Monetary Aggregate for the 1990s? (clevelandfed.org); Institutional MMF are now subject to floating net asset value (NAV) rules, thereby increasing the potential for less than $1-for-$1 redemptions. Money Market Mutual Funds: A Financial Stability Case Study (congress.gov)
[12] Federal Funds Effective Rate | (stlouisfed.org)
[13] The X-axis equals 10Y-FFR(year) – 10Y-FFR(year-2), and the Y-axis equals CPI(year) – CPI(year-2)
[14] Yield Curve and Predicted GDP Growth: Background and Resources (clevelandfed.org); Business Cycle Dating | NBER
[15] Federal Reserve Reform Act of 1977 | Federal Reserve History; “The Board of Governors of the Federal Reserve System and the Federal Open Market Committee shall maintain long run growth of the monetary and credit aggregates commensurate with the economy’s long run potential to increase production, so as to promote effectively the goals of maximum employment, stable prices, and moderate long-term interest rates.”
[16] Is the Phillips Curve Still Alive? | St. Louis Fed (stlouisfed.org)
[17] The FFR ranged between 0.0% and 0.25% from the end of 2008 until the end of 2015.
[18] The Fed – Implementing Monetary Policy in an “Ample-Reserves” Regime: The Basics (Note 1 of 3) (federalreserve.gov); The Fed – Implementing Monetary Policy in an “Ample-Reserves” Regime: Maintaining an Ample Quantity of Reserves (Note 2 of 3) (federalreserve.gov); The Fed – Implementing Monetary Policy in an “Ample-Reserves” Regime: When in Crisis (Note 3 of 3) (federalreserve.gov); Teaching New Tools of Monetary Policy | (stlouisfed.org)
[19] Federal Reserve Board – Interest on Reserve Balances
[20] The Fed sets a target range for the FFR and uses its policy tools to achieve that result, although it is debatable how much the Fed leads or follows the market when setting the target range. The Fed Funds Rate’s Impact on Other Interest Rates (stlouisfed.org)
[21] Bank reserves are not necessary to make loans and create deposits, but when banks are unable to meet depositor demand for withdrawals – either from their own reserves or those borrowed from other banks (or Fed) – they face insolvency and resolution by the Federal Deposit Insurance Corporation (FDIC). FDIC | Resolutions
[22] Interest on Reserves: History and Rationale, Complications and Risks | Cato Institute
[23] FAQs: Overnight Reverse Repurchase Agreement Operational Exercise – (newyorkfed.org)
[24] Historical Tables | The White House (Table 2.5)
[25] The Fed – Annual Report (federalreserve.gov) (Table G.9 and Table G.10)
[26] System Open Market Account Holdings of Domestic Securities – (newyorkfed.org); Interest Rate on Reserve Balances (IORB) | (stlouisfed.org)
[27] Federal Reserve Board – Fed’s balance sheet (Table 2)
[28] Assuming interest rates were the same at all maturities (i.e. the yield curve is flat), if annual interest rates rise from 2% to 4%, the market value of existing one-year securities would decrease by 2%, whereas the market value of existing thirty-year securities would decrease by 35%, as follows: 1/(1+r’)^n + (1*r)*(1-(1/(1+r’)^n))/r’, where r is the old interest rate (2%), r’ is the new interest rate (4%), and n is the number of years (1 or 30).
[29] When interest rates rise on newly issued bonds, the price of previously issued bonds must fall in order to equalize the yield between new and old bonds.
[30] Estimates assume bank reserves are $8.5 trillion ($2.5 trillion in currency) and Fed securities are $8.5 trillion with an initial average interest rate of 2.2%.
[31] 201301pap.pdf (federalreserve.gov) (Page 5)


