Download the pdf: Taxing-Social-Security-Benefits.pdf
Introduction
Prior to 1984, Social Security benefits were exempt from federal income taxes. Based on the recommendation of the 1983 Greenspan Commission, Congress enacted legislation to require Social Security beneficiaries with income above certain thresholds to pay taxes on a portion of their benefits.
Legislation was recently introduced to gradually phase out the taxation of Social Security benefits.[1] This issue brief will examine the history and rationale for taxing benefits, compare the tax treatment of Social Security to annuities from defined benefit pension plans, and examine how the taxation of benefits affects the program’s finances. It concludes that Social Security benefits are treated more favorably than annuities, and repealing the tax on benefits could adversely affect the program more than the Trustees’ projections currently indicate.
From Gratuities to Annuities
Following the enactment of Social Security in 1935, the U.S. Treasury Department issued a series of tax rulings that determined Social Security benefits were not taxable because they could be considered gratuities or gifts.[2] However, these rulings ran counter to the popular view that Social Security benefits are earned annuities based on a lifetime of contributions. Thus, when the program was facing a financial shortfall in 1983, the Greenspan Commission recommended taxing a portion of benefits.
As originally enacted, this policy required beneficiaries with income above $25,000 (single) or $32,000 (couple) to include up to 50 percent of their Social Security benefits in their modified adjusted gross income.[3] The revenue resulting from the taxation of benefits is credited to the Social Security trust fund.
The rationale for taxing half the benefits is that the Social Security payroll tax is split 50/50 between workers and their employers. The workers’ half is included in their taxable income, whereas the employers’ half is not. Because half the contributions are taxed and half are not, it was suggested that half the benefits should be taxed, and half should not (see Appendix). The rationale for the $25,000 and $32,000 thresholds was to exempt lower income beneficiaries from paying taxes on their benefits. These thresholds are not indexed to inflation, which means the amount of benefits subject to tax will increase over time.
Congress enacted a new policy in 1993 to tax up to 85 percent of benefits for beneficiaries with total income above $34,000 (single) or $44,000 (couple). These thresholds are not indexed to inflation. The additional revenue from this policy (85% – 50% = 35%) is credited to the Medicare (HI) trust fund. The choice of 85 percent was based on previous calculations that showed workers earning the maximum taxable wage would contribute an amount equal to 17 percent of their lifetime benefits.[4] The remaining amount (83 percent) represents benefits that exceed the contributions of hypothetical workers who earned the maximum taxable wage.[5] The excess benefits are funded by employer contributions and general revenue used to redeem the trust fund which have not been taxed.
Figure 1 shows the amount of payroll taxes hypothetical workers at various wage levels would pay as a percentage of their lifetime benefits. Workers earning below the average wage would contribute an amount equal to less than 13 percent of their lifetime benefits, while workers earning above the average wage would contribute an amount equal to as much as 19 percent of their lifetime benefits. These hypothetical results would vary depending on the pattern of lifetime earnings, cost-of-living adjustments (COLAs), and life expectancy.[6]
Figure 1: Employee Share of Payroll Taxes as Percent of Lifetime Benefits for Hypothetical Workers
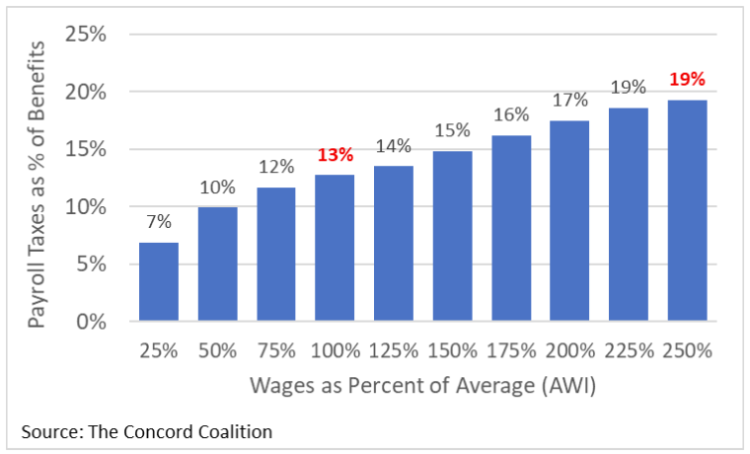
As Figure 1 shows, lower wage workers contribute less toward the cost of their benefits than higher wage workers even though the payroll tax rate is the same for everyone. This result is due to the progressive Social Security benefit formula that provides proportionally larger benefits (i.e., higher replacement rates) to lower wage workers relative to their contributions. Thus, excluding 15 percent of benefits from taxation might appear to advantage lower wage workers who contributed a lower percentage, and disadvantage higher wage workers who contributed a higher percentage. However, the amount of benefits subject to tax is determined by total income in retirement, rather than previous payroll taxes.
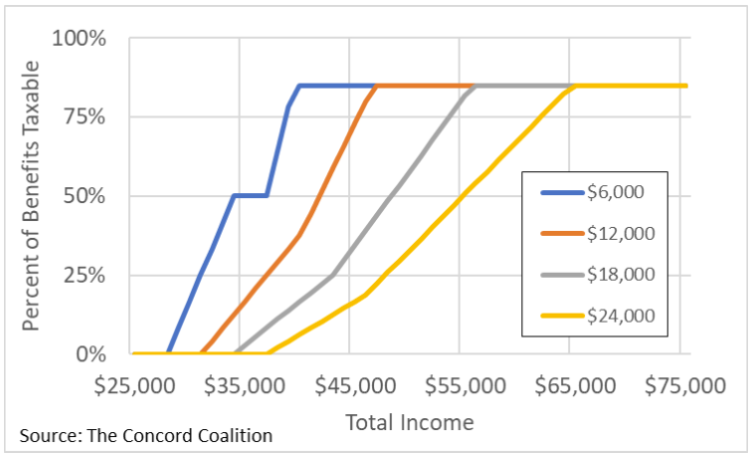
As Figure 2 shows, among beneficiaries with the same total income, those who paid less payroll taxes and receive smaller benefits are subject to tax on a greater share of their benefits than beneficiaries who paid more payroll taxes and receive larger benefits. For example, beneficiaries with $6,000 in annual benefits (blue line) are subject to tax on 50 percent of those benefits at $34,000 in total income and 85 percent at $40,000 in total income, whereas beneficiaries with $24,000 in annual benefits (yellow line) are subject to tax on 50 percent of those benefits at $55,000 in total income and 85 percent at $65,000 in total income.[7]
Figure 2: Percent of Social Security Benefits Subject to Income Tax for Hypothetical Beneficiaries
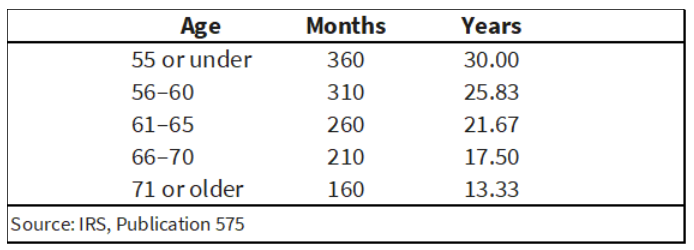
Unlike the taxation of Social Security benefits which varies depending on total income, the taxation of annuities provided by defined benefit pension plans is based entirely on employee contributions. Under current IRS regulations, individuals who receive monthly annuities are subject to income tax on the entire annuity, minus their own previous contributions, divided by their life expectancy at retirement.[8]
Figure 3 shows life expectancy factors for monthly annuities received by individuals retiring at various ages. These factors are used to determine the amount included in taxable income. For example, individuals retiring at age 65 would subtract an amount equal to 1/260th of their contributions from their monthly annuities and include the rest in their taxable income. These factors apply regardless of the individual’s total income.
Figure 3: Life Expectancy Factors for Monthly Annuities
The taxation of Social Security benefits generates a significant amount of revenue. In 2023, taxing up to 50 percent of benefits will generate $52 billion, and taxing up to 85 percent of benefits will generate $35 billion.[9] Taxing Social Security benefits in the same manner as monthly annuities would generate an additional $48 billion, bringing the total to $135 billion.[10] Thus, taxing benefits like annuities and crediting the revenue to the trust fund would substantially improve the program’s financial status. Conversely, repealing the taxation of benefits, as recently proposed, would have the opposite effect.
Repealing the tax on benefits would reduce revenue to Social Security by $6.3 trillion over the next 75 years (in present value) and increase the program’s unfunded obligations by 28 percent.[11]
Taxing Benefits in the Long-Run
Under current law, the Treasury Department estimates the amount of income taxes owed on Social Security benefits and credits that amount to the trust fund on a quarterly basis. These estimates are adjusted upward or downward when actual tax return data become available in subsequent years. For example, the 2014 estimate was adjusted in 2018 and 2019.[12]
During the first ten years of the 75-year projection period included in the annual Trustees’ report, the amount of taxes projected to be credited to the Social Security trust fund is based on estimates by the Treasury Department which reflect current law.[13] Because the income thresholds used to determine the taxation of benefits are not indexed, even a modest amount of inflation will gradually reduce these thresholds relative to rising incomes. Thus, a greater share of benefits will be subject to tax in the future.
Unlike the Social Security thresholds which are not indexed, the tax brackets, and other parameters of tax code are indexed to inflation.[14] But when incomes rise faster than inflation due to productivity growth, income taxes rise due to “bracket creep,” as individuals are forced to pay taxes on more of their income at higher tax rates due to the progressivity of the tax code.[15]
This bracket creep should also result in more income tax revenue for Social Security. However, the Trustees assume the tax code is indexed to wages, rather than prices, beyond the tenth year, thereby reducing the amount of taxes projected to be credited to the Social Security trust fund.[16]
Figure 4 compares the Trustees’ projection of taxes on benefits to the Congressional Budget Office (CB0) projection.[17] The Treasury Department’s estimates are initially higher than CBO’s estimates, likely due to differences in their respective income tax models.[18] However, beyond the tenth year, CBO’s model reflects the tax indexing provisions that exist under current law, whereas the Trustees assume these provisions no longer apply to Social Security. As a result, the Trustees’ projection of income taxes on benefits eventually falls below CBO’s projection.
Figure 4: Income Taxes on Social Security Benefits as Percent of Benefits
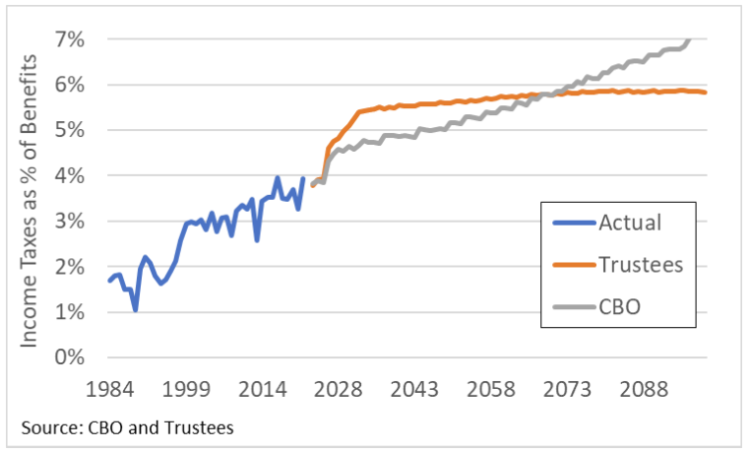
Until the differences between Treasury and CBO during the first ten years can be resolved, the long-term impact of the Trustees’ decision to disregard future bracket creep cannot be determined.
Conclusion
The taxation of Social Security benefits provides an important source of revenue to the program. However, current law limits the amount of benefits subject to taxation, thereby reducing the potential revenue gain. Taxing benefits like annuities and crediting the revenue to the trust fund would improve the program’s finances, whereas repealing the taxation of benefits would have the opposite effect.
_______________________________________________________________________
Appendix
The original 50/50 rule for taxing Social Security benefits has been compared to the tax treatment of Individual Retirement Accounts (IRAs).[19] Traditional IRAs exclude contributions from taxable income but tax withdrawals, whereas Roth IRAs tax contributions but exclude withdrawals from taxable income. When viewed from this perspective, workers’ payroll taxes are like Roth contributions, and employers’ payroll taxes are like Traditional contributions.
Figure A-1 shows how taxing either contributions (Roth) or withdrawals (Traditional), produces the same after-tax savings. In this example, the worker earns $1,000 in wages and pays $62 in payroll taxes. Because these payroll taxes are not deductible, the worker pays $15.50 in income taxes. The employer also pays $62 in payroll taxes, which are not included in the worker’s taxable income.
If both amounts ($46.50 and $62) were invested at 5% for 40 years, the worker’s contribution would result in net savings of $327.36, and the employer’s contribution would result in net savings of $327.36 ($436.48 – $109.12). Thus, it could be argued that the 50/50 rule is equivalent to the way IRAs are taxed.
Figure A-1: Comparison of Deductible and Non-Deductible Contributions
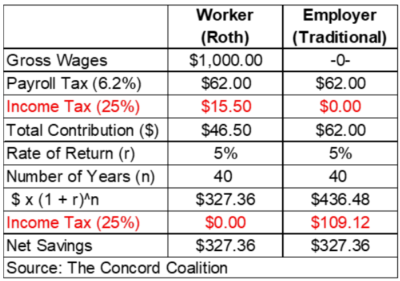
However, Social Security is a defined benefit plan, not a defined contribution plan. Thus, it could be argued that Social Security should be treated like other annuities, rather than like IRAs. That suggests the entire amount of savings ($327.36 + $436.48), minus the worker’s after-tax contribution ($46.50) should be subject to tax.
_______________________________________________________________________
[1] Ricketts Introduces Social Security Check Tax Cut Act | (senate.gov)
[2] Social Security History | (ssa.gov)
[3] Benefits Planner | Income Taxes And Your Social Security Benefit | (ssa.gov)
[4] Social Security History | (ssa.gov)
[5] Contribution and Benefit Base | (ssa.gov)
[6] The calculations in Figure 1 reflect the primary insurance amount (PIA) for workers with 35 years of constant earnings (relative to the AWI) who turn 62 in 2021, assuming annual COLAs of 2.4% and life expectancy of 20 years. Survivors receive the higher of their own benefit or their deceased spouse’s benefit. Lifetime Earnings Patterns, the Distribution of Future Social Security Benefits, and the Impact of Pension Reform | (ssa.gov); Distribution of Zero-Earning Years by Gender, Birth Cohort, and Level of Lifetime Earnings | (ssa.gov); C. Program-Specific Assumptions and Methods | (ssa.gov); V. Assumptions and Methods Underlying Actuarial Estimates | (ssa.gov)
[7] The Concord Coalition calculations based on Publication 915 (2022), Social Security and Equivalent Railroad Retirement Benefits | (irs.gov)
[8] Publication 575 (2022), Pension and Annuity Income | Internal Revenue Service | (irs.gov)
[11] B. Long-Range Estimates | (ssa.gov), Table IV.B6. ($6.3 trillion / $22.4 trillion = 28%) All figures are present values as of January 1, 2023. Present value calculations use the trust fund interest rate to convert projected future values into their current lump-sum equivalent. The lump-sum represents the amount needed to be invested today at the specified interest rate to produce the specified future value through the power of compound interest. The present value formula is PV = FV/(1+r)^n, where FV is the future value, r is the trust fund interest rate, and n is the number of years from the present to the future.
[13] 2023 Long-Range Model Documentation | (ssa.gov); 2023 Trustees Report | (ssa.gov), page 153
[14] IRS provides tax inflation adjustments for tax year 2023 | (irs.gov)
[15] How Income Growth Affects Tax Revenues in CBO’s Long-Term Budget Projections | (cbo.gov)
[16] Research: Income Taxes on Social Security Benefits | (ssa.gov); Answers to Questions for the Record Following a Hearing on Social Security’s Finances | (cbo.gov), page 4
[17] Trustees Report Single-Year Tables | (ssa.gov); CBO’s 2023 Long-Term Projections for Social Security | (cbo.gov)
[18] An Overview of CBOLT: The Congressional Budget Office Long-Term Model | (cbo.gov)
Continue Reading