Introduction
The annual Social Security and Medicare Trustees’ reports make numerous economic and demographic assumptions to project the long-term financial status of these two programs. Among these assumptions is the average number of births women will have over their lifetime. The number of births, along with immigration, determines the number of workers available to fund future benefits. Fewer workers mean bigger deficits for both programs.
The latest Social Security Trustees report includes a new method for projecting future births.[1] This method is a cohort-based approach, rather than the period-based approach used in previous reports. Although changes are warranted, the new method relies on optimistic assumptions and utilizes various ad hoc adjustments that may not be readily apparent to policymakers and the public. This issue brief will explain the new method and examine the implications of these assumptions and adjustments for future birth rates.
Period Rates vs Cohort Rates
As the Concord Coalition has previously noted, it is critically important to distinguish between period rates and cohort rates.[2] Period rates count annual births to women of all ages in a single year. Cohort rates count births that occur over the lifetime of all women born in the same year. Period rates tend to be more volatile than cohort rates and can provide a misleading indicator of lifetime births.
Cohort rates cannot be determined until all the women born in the same year have reached the end of their childbearing years. However, period rates can be used to project cohort rates by assuming the number of births that women have at each age in the future will maintain some relationship to the corresponding numbers in the present. The relationship assumed by the Trustees will be explained below.
When period rates are falling as they have been in recent years, it indicates one of two possible outcomes. Either women have decided to have fewer children, and cohort rates will fall as well; or women have decided to have fewer children now and more children later, in which case cohort rates will not fall.[3] Although either scenario is possible, the Trustees must decide which is more likely to occur.
Fertility Expectations
The role of the Trustees is to analyze historical data, assess current trends and make reasonable assumptions about the most likely course of future events. When it comes to projecting future births, the Trustees have emphasized the importance of fertility expectations. According to the National Survey of Family Growth (NSFG), since the early 1980’s women have consistently expected to have slightly more than two children on average over their lifetime.[4] Thus, despite the recent decline in the period rate, the Trustees assume the cohort rate will remain at two births per woman.
But there is increasing evidence to suggest that may not be the case. The most recent NSFG data (2017-2019) show actual births have fallen without a corresponding rise in expected births. Although the sum of actual births and expected births is still greater than two, historically, women have fallen short of their expectations by 0.3 births and this shortfall is expected to rise in the future, potentially exceeding 0.4 births.[5] That means future cohort rates would fall within the range of 1.7 to 1.8 births per woman.[6]
Figure 1: Total Births Among Women by Age in Year of Survey
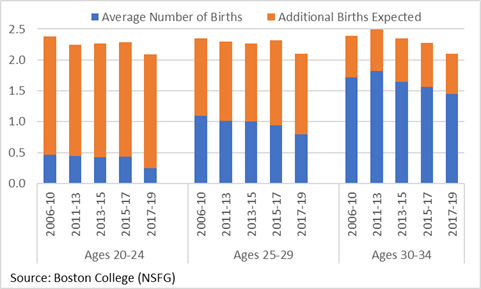
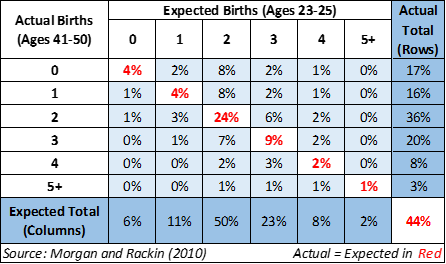
Studies show the correspondence between expected births and actual births is largely accidental. Most women have either more children or fewer children than expected, with individual discrepancies roughly offsetting in the aggregate. For example, a survey of women born 1957-1964 found only 44 percent ended up with the same number of children they expected, with 35 percent having fewer and 22 percent having more.[7] Thus, expected fertility of 2.21 ended up being 1.97.
Figure 2: Distribution of Actual Births vs Expected Births (1957-1964 Birth Cohorts)
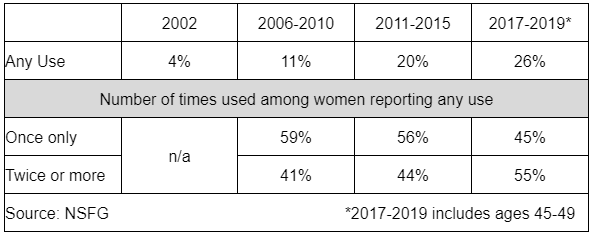
In addition, the increasing use of emergency contraceptives (EC) and long-acting reversible contraceptives (LARCs) may be increasing the gap between expected births and actual births.[8] A recent survey concluded women are reporting fewer pregnancies they describe as “wanted later or not wanted.”[9] To the extent younger women are using ECs and LARCs to avoid having children before they are ready, they may have more difficulty getting pregnant when they are older, resulting in fewer births than expected.[10]
Table 1: Percent of Women Ever Using Emergency Contraceptives (Ages 15-44)
Cohort-Based Projections
The Trustees’ assumption that cohort rates will remain at two births per woman reflects their belief that falling births among younger women will subside and subsequently be offset by rising births among older women. To support this conclusion, the Social Security Administration developed a new cohort-based model to project future births.[11]
Any model used to project future birth rates must make several key assumptions, including which historical period is most relevant to consider when projecting future outcomes; and if historical trends are unsustainable, when and how will they change?
The new model adopted by the Trustees assumes the historical period since the mid-1970s is most relevant to current conditions. This assumption is consistent with the fact that the birth control pill, approved by the FDA in 1960, did not become widely available until two landmark Supreme Court decisions in 1965 and 1972.[12] The impact of these decisions can be seen in Figure 3, which shows the maximum average annual birth rate for women of all ages has remained below 0.13 since 1973.[13]
Figure 3: Average Annual Birth Rates for Cohorts Age 14 from 1933 to 2019
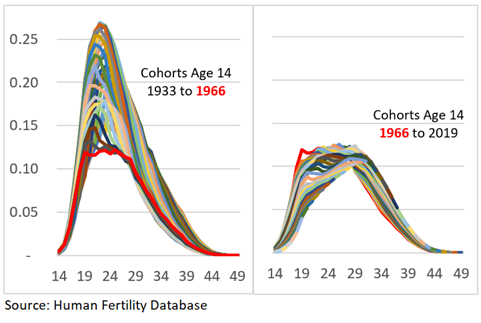
An examination of the historical period (1975-2020) selected by the Trustees reveals the trend in birth rates at every age under 28 is declining and birth rates under 19 will fall to zero within the next few decades. To avoid this outcome, the new model assumes birth rates under 20 stop their decline and birth rates between 20 and 49 close the gap (at least partially) between current levels and future trend lines. See the appendix for more details.
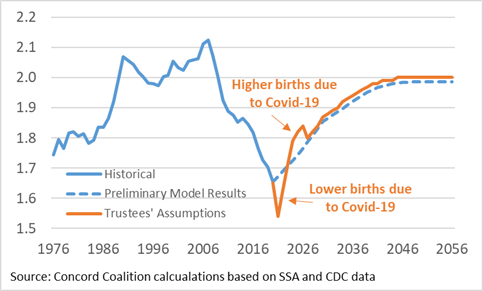
These assumptions are used to produce preliminary model results that are subject to an ad hoc adjustment to generate the ultimate intermediate assumption of two births per woman. Finally, the modified results are adjusted to reflect fewer births in 2021 and 2022 due to Covid-19, and more births in 2024 to 2026 to offset the earlier losses.
Figure 4 shows the total period fertility rate for the historical period and the projection period using the preliminary model results and the final Trustees’ assumptions. Birth rates at each age are assumed to remain constant after 2056 resulting in the convergence of period rates and cohort rates at two births per woman.
Figure 4: Total Period Fertility Rates 1976-2056
Alternative Assumptions
The results of any model depend on its assumptions. Different assumptions will produce different results. As noted above, the increasing use of the birth control pill caused a dramatic decline in annual birth rates by the mid-1970s. The increasing use of ECs and LARCs is now contributing to another period of decline, suggesting greater emphasis should be placed on more recent trends.
If the Trustees’ assumptions were adjusted to reflect the 1985-2020 period, rather than 1975-2020, then the preliminary model results produce an ultimate cohort birth rate of 1.90.
If the decrease in births at younger ages and the increase in births at older ages were adjusted to reflect a more gradual transition, then the preliminary model results produce an ultimate cohort birth rate of 1.90.[14]
Combining these two alternative assumptions would produce an ultimate cohort birth rate of 1.83 births per woman.
Conclusion
Projecting the long-term financial status of Social Security and Medicare requires making numerous assumptions about future events, including expected fertility rates. After the post-Baby Boom decline in the 1970s, period rates generally followed an upward trend for more than 30 years. Since 2007, however, period rates have fallen almost continuously, reaching record lows in recent years. The Covid-19 pandemic will undoubtedly extend the period of decline.[15]
Despite recent events, the Trustees appear to remain steadfast in their belief that women will continue to have an average of two children each on a lifetime basis. But recent data on birth expectations and alternative birth control methods suggest there is significant downside risk to their projections. For cohort rates to remain at 2.0, birth rates among older women will need to increase enough to offset the decline in birth rates among younger women. So far, that hasn’t happened.
While the future is always uncertain, the Trustees would be well-advised to reconsider their fertility rate assumptions.
Appendix
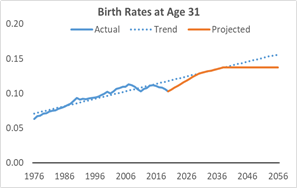
The Trustees’ new model differs from the old model by assuming future birth rates will reach their ultimate (constant) values in one additional year for each subsequent age between 14-49. (Births under 14 are assumed to occur at 14 and births over 49 are assumed to occur at 49.) Expressed as a formula (2020 + age – 13), the ultimate rate for age 14 is attained in 2021, whereas the ultimate rate for age 49 is attained in 2056.
Thus, women who turn 14 after 2021 will have the same birth rate at age 14 as women who turned 14 in 2021. Women who turn 49 after 2056 will have the same birth rate at age 49 as women who turned 49 in 2056. Ultimate birth rates between 14 and 49 are attained between 2021 and 2056, based on the formula above.
To determine the ultimate rates for each age, the new model assumes the gap between the historical trend line (1975-2020) and the corresponding value in 2020 is reduced or eliminated (depending on age) and then follows the slope of the trend line until the year specified by the formula above. The value in the specified year is assumed to be the ultimate rate. See the figures below for examples of select ages.
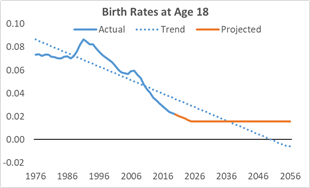
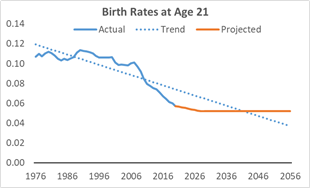
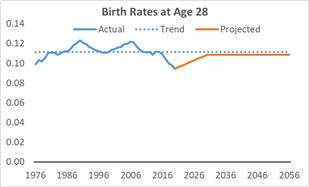
Source: Concord Coalition calculations based on SSA and CDC data
[1] V. ASSUMPTIONS AND METHODS UNDERLYING ACTUARIAL ESTIMATES (ssa.gov)
[2] What’s Up with Falling Birth Rates? | Concord Coalition
[3] If births remained constant at every age, then period rates and cohort rates would be equal.
[4] 2021_Long-Range_Demographic_Assumptions.pdf (ssa.gov); Chart 1.5
[5] Will Women Catch Up to Their Fertility Expectations? (bc.edu) and unpublished data provided by author
[6] (2.1 – 0.3) = 1.8 and (2.1 – 0.4) = 1.7
[7] The Correspondence Between Fertility Intentions and Behavior in the United States (nih.gov) Does not sum to 100 due to rounding
[8] NSFG – Listing E – Key Statistics from the National Survey of Family Growth (cdc.gov); 2017-2019 NSFG Female Respondent Section E Codebook (cdc.gov) Percent of women ever having sexual intercourse with a male; NCHS Data Brief, Number 112, February 2012 (cdc.gov); Changes in use of emergency contraceptive pills in the United States from 2008 to 2015 – ScienceDirect ; NCHS Data Brief,Number 188,February 2015 (cdc.gov)
[10] Female Age-Related Fertility Decline | ACOG
[11] 2021_LR_Model_Documentation.pdf (ssa.gov)
[12] Griswold v Connecticut (June 7, 1965) held the right to privacy prevents states from making the use of contraceptives by married couples illegal. Eisenstadt v Baird (March 22, 1972) applied this right to unmarried couples. Pill-History-FactSheet_June2015_r1.indd (plannedparenthood.org)
[13] Human Fertility Database; Concord Coalition calculations
[14] The formula used to close the gap between current births and the projected trend line is (age – 24) / (35 – 24), rather than (age – 19) / (30 – 19)


