By Richard Jackson, Global Aging Institute
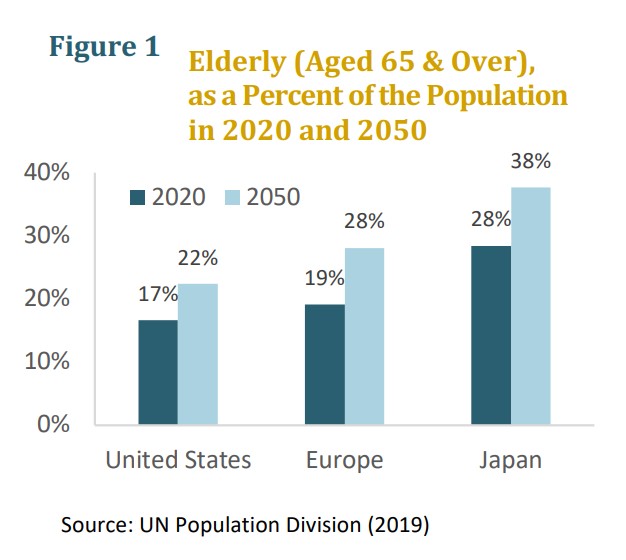
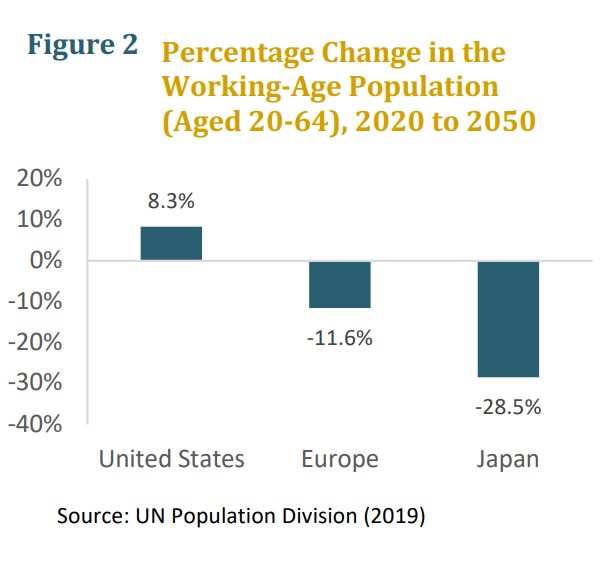
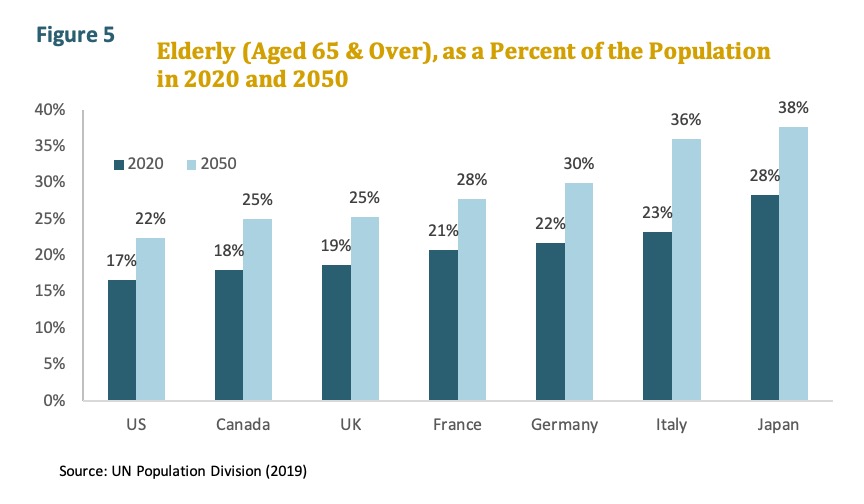
America, along with the rest of the developed world, is being overtaken by a stunning demographic transformation called global aging. By 2050, the elderly share of the U.S. population, which was 12 percent as recently as 2000, will climb to 22 percent. In Europe the elderly share of the population will reach 28 percent, and in Japan, which is ground zero for global aging, it will reach 38 percent. Most developed countries will not only have aging populations, but stagnant or declining ones. By the 2030s, workforce growth will slow to near-zero in the United States, while in Japan and some European countries workforces will be contracting by between 1.0 and 1.5 percent per year.1
A QUARTERLY SERIES
The Shape of Things to Come
Over the next few decades, the aging of America promises to have a profound effect on the size and shape of our government, the dynamism of our economy, and even our place in the world order. The Concord Coalition and author Richard Jackson of the Global Aging Institute (GAI) have joined forces to produce a quarterly issue brief series that explores the fiscal, economic, social, and geopolitical implications of the aging of America. Although the series is U.S. focused, it also touches on the aging challenge in countries around the world and draws lessons from their experience. Concord and GAI hope that it will inform the debate over the aging of America and help to push it in a constructive direction.
Global aging poses enormous challenges. Graying means paying more for pensions, more for health care, and more for long-term care for the elderly. Even as fiscal burdens rise, economic growth will slow as employment growth falls, workforces gray, and rates of savings and investment decline. Aging electorates may become more risk- averse, have shorter time horizons, and be more prone to protect current consumption claims on government budgets at the expense of investments with long-term payoffs. As the developed world shrinks in demographic and economic size relative to a faster- growing developing world, its geopolitical stature may also be diminished.
America is now in the midst of a pandemic that is putting both our health and our economy at immediate risk. Understandably, societies grappling with near-term crises find it difficult to focus on long-term challenges. But the crisis triggered by the coronavirus will pass, and when it does the challenge posed by the aging of America’s population will remain. That challenge, moreover, will be even more daunting than it was before, since America will be confronting it in the wake of a deep recession and a massive runup in the public debt. This in turn means that the need for constructive reform will be even more urgent than it was before.
It is with this in mind that we launch The Shape of Things to Come, an issue brief series that explores the fiscal, economic, social, and geopolitical implications of the aging of America. Although the series is U.S. focused, it also touches on the aging challenge in countries around the world and draws lessons from their experience.
In this inaugural issue, we discuss the U.S. demographic outlook and the underlying forces shaping it. As with most stories, there is some good news and some bad news. The good news is that America is not projected to age as much as many of its developed-world peers. (See figures 1 and 2.) The bad news is that the relatively favorable U.S. demographic outlook is deteriorating. America’s unusually large Baby Boom, moreover, means that its age wave is rolling in unusually fast. The fiscal and economic shock may thus be as large or even larger than in many countries due to age more than America is.
The End of U.S. Demographic Exceptionalism
There are two forces behind the aging of the population. The first force is falling fertility. People are having fewer babies, and this decreases the relative number of young in the population. The second force is rising life expectancy. People are living longer, and this increases the relative number of old.2 In addition to altering the age structure of the population, these forces can also alter its growth rate, usually reducing it since falling fertility tends to hollow out the base of the population pyramid much faster than rising life expectancy fills in the top. Net immigration (arrivals minus departures) sometimes constitutes a third force. When net immigration is increasing it can mitigate population aging, and when it is decreasing it can exacerbate population aging.
Although rising life expectancy may be the force that first leaps to mind when people think of population aging, falling fertility is the more quantitatively important driver. Differences in fertility rates, moreover, explain much more of the variation in the projected degree of population aging across the developed countries than differences in life expectancy do. Life expectancy at birth in the developed world now ranges between a low of 79 in the United States and a high of 84 in Japan—a difference of just five years. The fertility rate in the highest-fertility developed country (New Zealand, at 1.9 average lifetime births per woman) is now nearly twice as high as the fertility rate in the lowest-fertility one (South Korea, at 1.1 average lifetime births per woman). Absent large-scale immigration, it is the countries with the lowest fertility rates that will age the most. It is also the countries with the lowest fertility rates that have or will soon have contracting workforces.
It is often assumed that the trend toward smaller families began with the end of the postwar Baby Boom. But in fact, fertility rates in the United States and most of today’s developed countries began declining in the nineteenth century, and by the Second World War were already approaching the so-called 2.1 replacement rate needed to maintain a stable population from one generation to the next. After a temporary, and in some cases dramatic reversal during the 1950s and 1960s, the decline once more resumed. What was new was that fertility rates now plunged beneath the replacement rate, and in some countries far beneath it, something which had never before happened in human history, except in times of war, famine, or pestilence. At first most demographers assumed that this was an aberration, and that fertility rates would soon rise again. But below-replacement fertility has proved to be lasting. Every major developed country has been beneath the replacement rate for at least a generation and many have been beneath it for two.
The collapse in fertility rates that followed the Baby Boom had many causes, including rising educational attainment, the mass entry of women into the labor market, declining religiosity, and more widely available contraception and abortion. What all of these causes have in common is that they are deeply rooted in economic, social, and cultural developments that are unlikely to be reversed anytime soon.
Until recently, the United States was an outlier on the developed-world fertility spectrum. After dipping well beneath replacement in the 1970s, its fertility rate partially recovered as late-birthing Boomers finally got around to starting families. (See figure 3.) From the beginning of the 1990s until the Great Recession of 2008-09, the fertility rate averaged 2.0, slightly beneath replacement but still higher than that of any other developed country except Iceland and New Zealand. Together with substantial net immigration, America’s relatively high fertility rate seemed to ensure that it would remain the youngest of the major developed countries. It also seemed to ensure that America would still have a growing workforce, even as those in other developed countries stagnated or declined. The U.S. outlook was so strikingly different from that in the rest of the developed world that the demographer Nicholas Eberstadt coined the term “demographic exceptionalism” to describe it.3
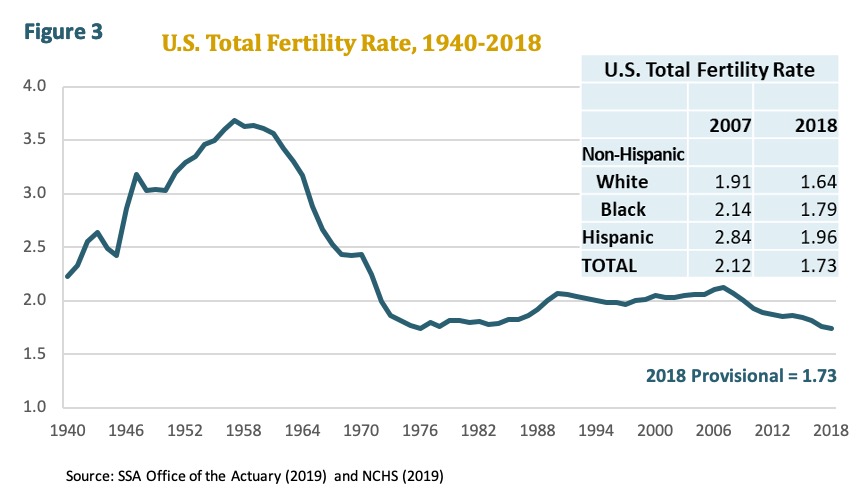
Over the past decade, however, America has begun to look much more like a normal developed country. The U.S. fertility rate has been falling steadily since 2008, and as of 2018 stood at 1.7, the lowest level on record. Some demographers hope that the decline is largely a “tempo effect,” and that Millennials are merely postponing family formation as they struggle to launch careers and establish independent households, rather deciding to have fewer children. But as yet there is no clear sign of an uptick in the age-specific fertility rates of women in their early thirties, which one would expect to have seen by now if this were the case. And if that uptick has not happened yet, it is unlikely to happen anytime soon. One of the things that history teaches about pandemics is that they typically depress fertility, at least for a while. To make matters worse, net immigration, which in the near term acts much like a higher fertility rate, has also declined since the Great Recession.
These developments could well spell the end of U.S. demographic exceptionalism. To be sure, the decline in fertility over the past decade is not large enough to put America on the ruinous demographic trajectory of a Greece, Italy, Spain, Japan, or South Korea, where fertility rates now range between 1.1 and 1.4. But unless fertility rebounds, the United States may age significantly more than is currently projected.4
Longevity Leader to Longevity Laggard
Even as fertility has plunged in the developed world, life expectancy has soared. In the United States, life expectancy at birth was just 47 in 1900, meaning that barely half the population reached what we now consider midlife. By 1950 it had risen to 68, an increase of twenty-one years. Since then it has risen another eleven years to 79. Other developed countries have registered similar or even more impressive gains.
Until the mid-twentieth century, increases in life expectancy were primarily attributable to reductions in mortality from infectious diseases that afflict young and old alike. Since then, the dominant causes of mortality have shifted from infectious diseases to chronic diseases that mainly afflict older adults. As this so-called epidemiological transition has unfolded, progress in reducing mortality has also been increasingly concentrated at older ages. The result is that the odds of living from sixty to eighty or eighty to one hundred are now improving faster than the odds of living from twenty to forty or forty to sixty, which are already very high.
There is considerable debate over how much further life expectancy is likely to rise. The pessimists argue that there is a fixed limit to the human lifespan, which is generally assumed to be between 110 and 120 years. As life expectancy increases and more people bump up against the limit, the potential for additional improvements will necessarily diminish. The optimists argue that there is little evidence to support this “fixity thesis.” If there really were a fixed limit to the human life span, we would expect to see improvements in life expectancy at the very oldest ages slowing relative to those at somewhat younger ages. We would also expect to see differences in life expectancy by country, region, and socioeconomic status narrowing. Yet there are few indications that any of this is happening. Everywhere, or at least almost everywhere, people are living longer, yet some groups of people are still living longer than others. The conclusion the optimists draw is that there may be no fixed limit to the human life span, or at least that if there is one we do not yet show any signs of reaching it.5
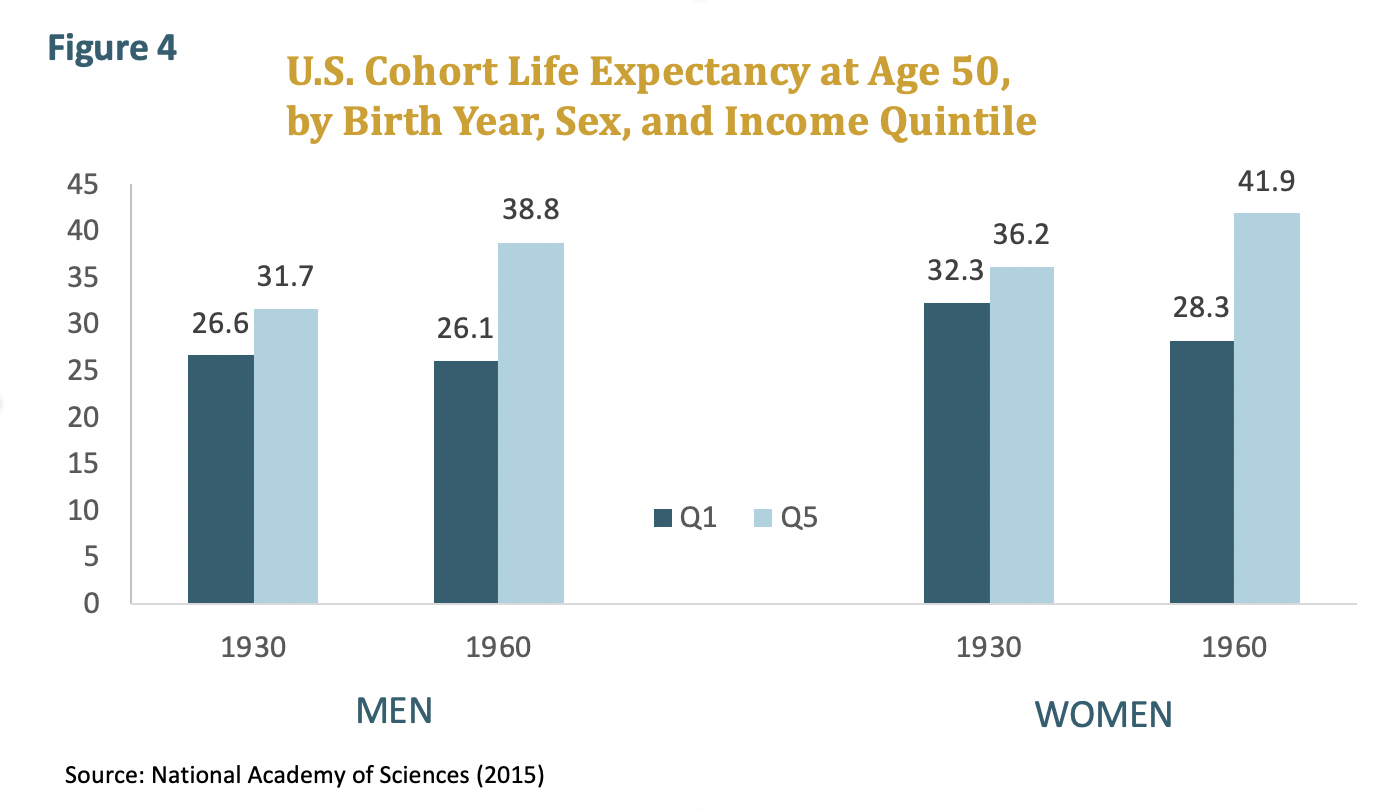
While the longevity optimists may turn out to be right, recent trends in the United States are far from encouraging. America was once the developed world’s longevity leader, but is now its longevity laggard. In the early 1950s, U.S. life expectancy at birth was one year above the developed-world average. As recently as the early 1980s, it was about equal to the developed-world average. Today, it is three years below the developed-world average. In three of the last four years for which there are data U.S. life expectancy actually fell, and as of 2018 it was no higher than it was in 2010. There are also enormous, and widening, differences in life expectancy by income and educational attainment. According to the National Academy of Sciences, life expectancy at age 50 for men born in 1960 is thirty- nine years for those in the highest quintile of the income distribution, while it is just twenty- six years for those in the lowest—a gap of thirteen years. The corresponding life expectancy gap by income at age 50 for women born in 1960 is fourteen years.6 (See figure 4.)
The root causes of the poor U.S. performance, which include high inequality and uneven access to the health-care system, are complex and controversial. At least one proximate cause, however, is clear: America has a much worse health profile than other developed countries. U.S. survival rates for most major chronic diseases are actually among the highest in the world, which should not be surprising given how much America spends on advanced medical technology. The problem is that the United States has a higher incidence of chronic morbidity than other developed countries. In other words, it is not that a larger share of sick Americans die, but that a larger share of Americans get sick. America’s higher incidence of chronic morbidity is largely attributable to lifestyle-related risk factors, and especially its current higher rates of obesity and substance abuse and its historically higher rate of smoking.7 These risk factors are of course highly correlated with income and educational attainment. Although they are not the only reason why U.S. life expectancy varies so much by socioeconomic status, they are an important one.
Up to now, the stall in U.S. life expectancy has been mostly attributable to rising morbidity and mortality among midlife adults. The life expectancy of the elderly has continued to rise, albeit slowly, in part because the current generation of elderly is less afflicted by America’s lifestyle plagues than younger generations are. As a result, the gap in life expectancy between the United States and other developed countries is wider for the population as a whole than it is for the elderly. If we compare life expectancy at birth, America has sunk to the very bottom of the developed-world heap. But if we compare life expectancy at age 80, America is still near the very top. Whether this will last, however, is doubtful, since Boomers are taking both their good habits and bad habits with them into old age.
To be sure, the upward march in life expectancy has stalled before in the United States, only to resume. Improvements were especially rapid from the late 1960s through the early 1980s, slowed from the early 1980s through the late 1990s, then sped up once more in the 2000s, only to stall again over the past decade. This pattern helps to explain why all U.S. population projections, including those by the Census Bureau and the Social Security Administration, assume that U.S. life expectancy will begin to rise again. According to the UN Population Division, whose projections are used in this issue brief, it will reach 83 by 2050, an improvement of four years over today. Although this improvement is not negligible, it is worth noting that it would still leave us lagging virtually every other developed country, where the UN projects that life expectancy will be rising at least as fast as it will be here.
The Boomer Show
Many people equate the aging of the Baby Boom generation with the aging of America. Although this is understandable, it is inaccurate. America is aging because fertility rates have fallen and life expectancy has risen, and it would be doing so even if the Baby Boom had never taken place. The existence of the Baby Boom, however, has affected the timing of America’s aging, initially slowing it but now accelerating it.
Although the fertility rate rose in most developed countries in the immediate postwar decades, it spiked much higher in the United States than anywhere else except Canada, Iceland, Ireland, and New Zealand, rising all the way from 2.5 in 1945 to 3.7 at the mid-1950s peak of the Baby Boom. Until around 2010, the passage of the Baby Boom bulge through childhood, young adulthood, and midlife slowed the aging of the U.S. population.
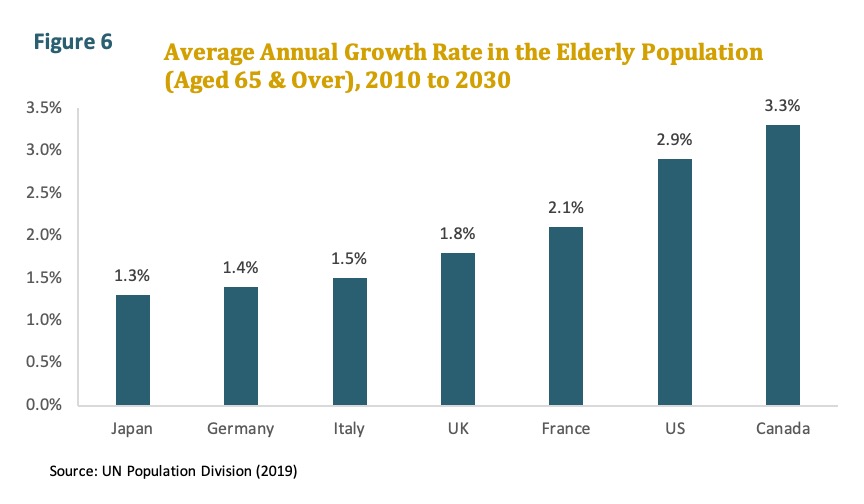
But since then, its passage into old age has been accelerating it. While America may ultimately age less than most developed countries, its elderly population is now growing more rapidly than almost anywhere else. (See figures 5 and 6.) The pressure of population aging has been ramping up steadily in other developed countries for decades, encouraging governments to engage the challenge and, in many cases, to enact sweeping old-age benefit reforms. After a long period of favorable demographics in which the need for reform seemed less urgent, America’s age wave is arriving with a bang.
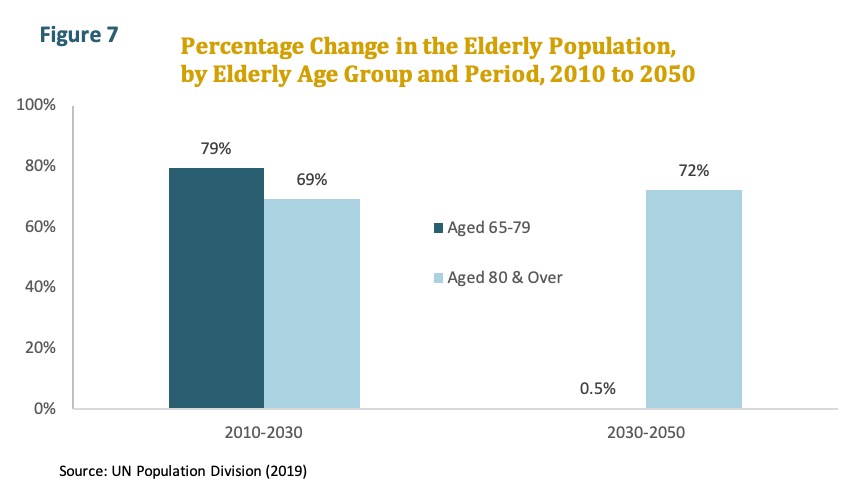
There is yet one more episode in the long-running Boomer show that has yet to air. Over the next decade, Boomers will continue to swell the ranks of the “young old” in their sixties and seventies. By the 2030s, however, they will be swelling the ranks of the “old old” in their eighties and nineties, who are far less likely to be employed than the young old are and far more likely to be frail, disabled, or suffering from dementia. (See figure 7.) Aging Boomers are already pushing up the cost of Social Security and Medicare. Their impact on long-term care, which may be the most explosive dimension of old-age dependency, still lies over the horizon.
The aging of America is inevitable. The prospects for higher fertility look dim. Even if the fertility rate were to surge overnight, moreover, it would not have an appreciable effect on the ratio of workers to retirees or the growth rate in employment for another twenty to twenty-five years, the time it takes to turn a newborn baby into a fully productive adult. The prospects for higher net immigration also look dim, and are likely to grow even dimmer in the wake of the current pandemic. Even if America again became more welcoming toward immigrants, moreover, it might not do much to alter its long-term aging trajectory. Because immigrants tend to be younger on average than the native-born population, they can boost employment growth and act as a brake on population aging. But immigrants have the unfortunate habit of growing old in their turn, which means that a one-time increase in net immigration will do little to alter the long-term age structure of the population. Slowing population aging through higher immigration requires not only a permanent increase in the net immigration rate, but an increase that continues to grow over time. As for life expectancy, we should all hope that it resumes it rise.
But if the aging of America is inevitable, fiscal and economic catastrophe is not if we prepare and adapt. To be sure, aging will always entail some extra fiscal burden. The old necessarily consume more in medical and long-term care services than the young, and no matter how long people continue to work there comes a time when almost everyone either wants or needs to retire. By the same token, aging will always entail some drag on economic growth. But the magnitude of the extra burden and the extent of the drag will depend on the policy choices we make. In subsequent issue briefs, we will dig deeper into the implications of the aging of America, as well as explore some of the possible responses. Next up: the potential economic, fiscal, and personal benefits of longer work lives.
1 All demographic projections cited in this issue brief refer to the UN Population Division’s latest “medium variant” projections published in World Population Prospects: The 2019 Revision (New York: UN Population Division, 2019). We use the UN’s projections for the United States, rather than the U.S. Census Bureau’s projections, in order to ensure comparability with other countries.
2 In this issue brief, the terms fertility and fertility rate refer to the total fertility rate or TFR, a period estimate of fertility commonly used by demographers. Unless it is otherwise specified or clear from the context, the term life expectancy refers to unisex life expectancy at birth.
3 Nicholas Eberstadt, “Demographic Exceptionalism in the United States: Tendencies and Implications,” Agir 29 (January 2007).
4 The latest UN projections used in this issue brief, as well as the latest U.S. Census Bureau projections, available at https://www.census.gov/programs-surveys/popproj.html, were made before the most recent fertility data were released and do not fully reflect them. The latest Social Security Administration projections incorporate the most recent data, but assume a rebound in fertility. See The 2020 Annual Report of the Board of Trustees of the Federal Old-Age and Survivors Insurance and Federal Disability Insurance Trust Funds (Washington, DC: Social Security Administration, April 2020).
5 For a discussion of the different schools of thought on future improvements in life expectancy, see Richard Jackson and Neil Howe, The Graying of the Great Powers: Demography and Geopolitics in the 21st Century (Washington DC: Center for Strategic and International Studies, 2008), pp. 54-59.
6 National Academy of Sciences, The Growing Gap in Life Expectancy by Income: Implications for Federal Programs and Policy Responses (Washington, DC: The National Academies Press, 2015).
7 For a review of the cross-country evidence on life expectancy and lifestyle, see Samuel H. Preston and Jessica Ho, “Low Life Expectancy in the United States: Is the Health Care System at Fault?” in International Differences in Mortality at Older Ages: Dimensions and Sources, eds. Eileen M. Crimmins, Samuel H. Preston, and Barney Cohen (Washington, DC: The National Academies Press, 2010).
Continue Reading