It is increasingly clear that the U.S. is not going to get the V-shaped recovery many economists predicted when the COVID-19 pandemic forced a substantial shutdown of the economy in March. While there were some hopeful signs in May and June, a resurgence of the virus in many states since then has slowed the recovery and prompted fears that the negative economic effects of COVID-19 may be wide-spread and long-lasting. This has introduced new challenges to an already daunting fiscal and economic outlook.
The devastating impact of COVID-19 on the budget and the economy can be seen in several grim metrics:
-
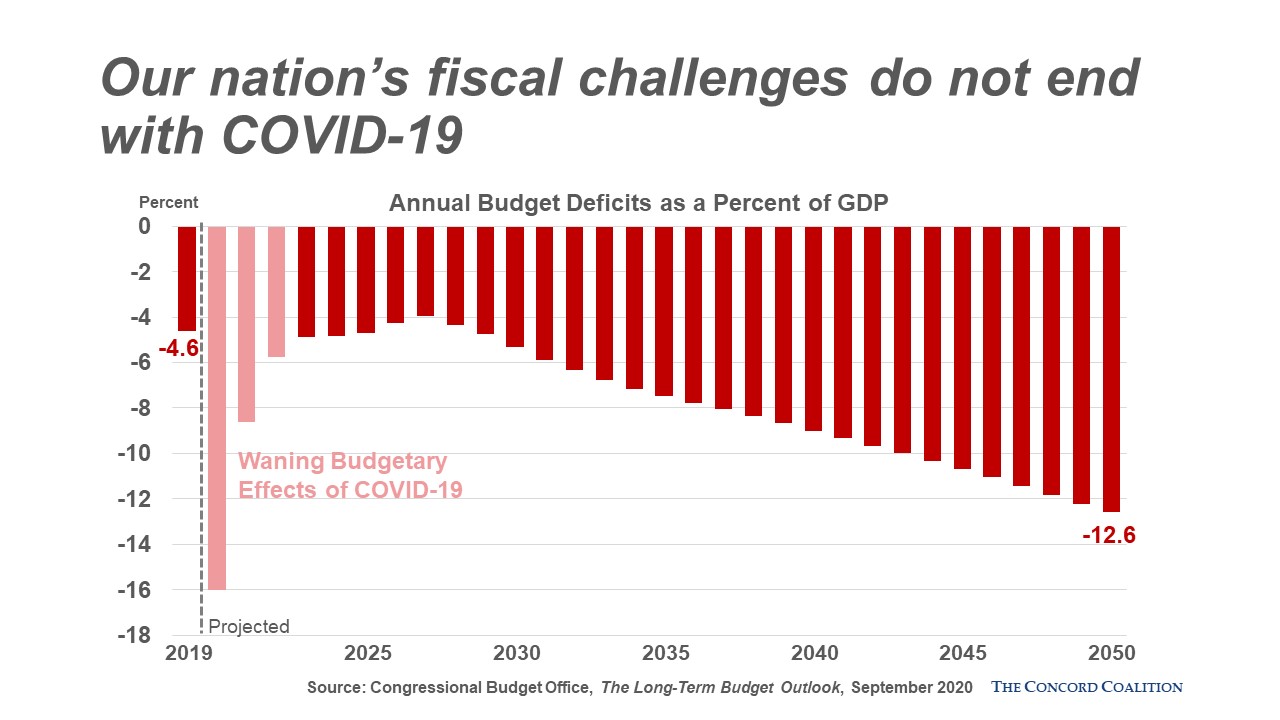
The budget deficit more than tripled from $984 billion in 2019 to $3.1 trillion in 2020. The projected deficit for the current fiscal year, which began October 1, is $1.8 trillion, assuming no further COVID-19 relief. Legislation.
-
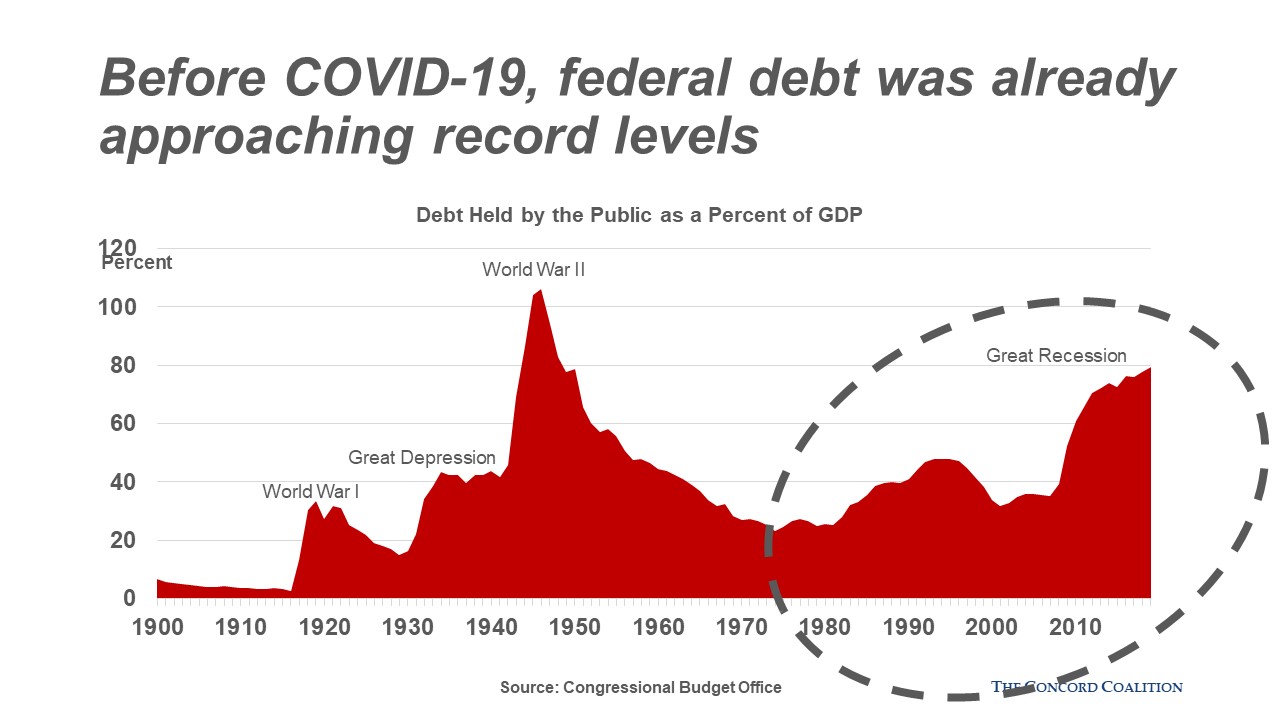
Debt held by the public grew from 79 percent of the gross domestic product (GDP) in FY 2019 to an estimated 98 percent of GDP in 2020. It is expected to top 100 percent of GDP in FY2021 and reach 107 percent of GDP in 2024, breaking the post-World War II record.
-
At an annualized rate, GDP fell by 5 percent in the first quarter of 2020 and by 31 percent in the second quarter.
-
Roughly 22 million jobs were lost in March and April, of which only half have been regained.
-
New weekly claims for unemployment insurance spiked to nearly 7 million in March and while dropping sharply since that peak, they have remained above 800,000, raising concerns of a sluggish and prolonged recovery. Average weekly initial unemployment claims averaged approximately 215,000 before the pandemic struck.
With numbers as stark as these it is little wonder that they have dominated the near-term debate over fiscal and economic policy. Unfortunately, they tend to obscure an even more fundamental problem that existed before the pandemic hit and will remain with us after the pandemic is brought under control: The budget is on a long-term path that is wholly unsustainable.
 Whoever is elected president in November will be called upon to treat both the current crisis and the pre-existing conditions that afflicted the economy before the pandemic hit.
With only one scheduled debate remaining between the presidential candidates, voters still need to hear about and evaluate the candidates’ plans for the next four years, not just the next few months. There is a direct link between the candidates’ fiscal policy proposals and their economic visions for the nation.
As explained by the Congressional Budget Office (CBO), “High and rising federal debt makes the economy more vulnerable to rising interest rates and, depending on how that debt is financed, rising inflation. The growing debt burden also raises borrowing costs, slowing the growth of the economy and national income, and it increases the risk of a fiscal crisis or a gradual decline in the value of Treasury securities.”
No plan for jump-starting the economy, let alone putting it on a solid pro-growth path, can succeed until the pandemic is brought under control. That will require an all-in effort by the federal government to backstop many segments of the economy and provide necessary testing, treatment and ultimately a vaccine.
In the near-term, concerns about budget deficits and the national debt will understandably take a back seat. They should not, however, be allowed to fade from the nation’s agenda.
Here are five key issues the winner of this year’s presidential election will need to confront in making plans for a post-pandemic budget:
-
Reducing health care cost growth;
-
Achieving sustainable solvency for Social Security;
-
Increasing labor force growth;
-
Improving worker productivity; and
-
Ensuring adequate revenues to support planned spending.
Health Care
Nearly 18 percent of economic activity in the United States involves health care and that is projected to grow in the future because health care costs have historically grown more quickly than the economy. This puts pressure on businesses, wages, and government programs. Federal health care programs accounted for over one-quarter of all government spending in 2019 (more than $1.1 trillion). In addition to health care cost inflation, our aging population will also drive up health care spending because there will be more Medicare and Medicaid beneficiaries.
Two important health care issues are sometimes conflated. “Who pays for health care?” is a discussion about insurance, whether through a government insurance program like Medicare or private sector insurance through one’s employer or the Affordable Care Act marketplace, both subsidized by the government through the tax code. “How much does insurance cost?” and how quickly those costs rise is a discussion about health care inflation and our country’s uniquely expensive and inefficient health care system.
The latter question is most important when considering the federal budget and it is the discussion that policymakers in Washington have been largely avoiding as they argue about who pays for health insurance.
Consider:
-
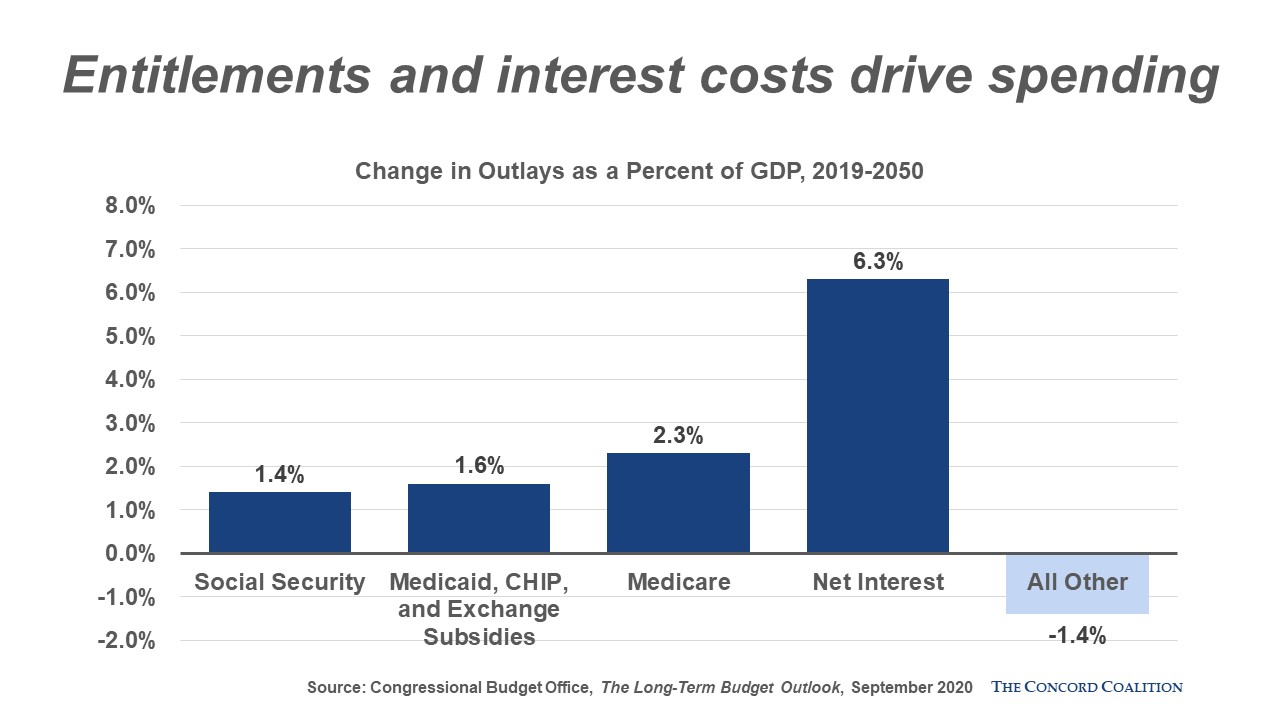
Over the next 10 years annual federal health spending is projected to nearly double to $2.1 trillion. Over 30 years, spending on federal health care programs is projected to grow from 5.3 percent of the economy (GDP) to 9.2 percent of GDP.
-
The US continually spends double the amount on health care per-capita versus other developed countries yet health outcomes are no better and often worse.
-
Population aging accounts for roughly one-third of the projected increase in federal health care spending over the next 30 years. The remaining increase is due to cost inflation.
-
There has been a recent slowdown in cost inflation — over the last decade costs have risen at about the same rate as economic growth. How much of the slowdown represents a permanent shift is uncertain, and every nonpartisan projection shows health care costs growing more quickly than the economy in the future.
Social Security
Social Security is a critical program that provides retirement and disability income to about 65 million Americans. It is also the largest federal program ($1 trillion in 2019), accounting for nearly one-quarter of all federal spending. Despite its dedicated revenues, however, Social Security promises more benefits in the future than it can deliver. Since 2010, Social Security benefit costs have exceeded the payroll taxes the government collects to fund the program and its trustees warn that the program cannot sustain its projected long-run costs.
Consider:
-
According to the Social Security trustees, the program will run operating deficits of $2 trillion over the next 10 years. Benefits can still be paid by cashing in government bonds in the trust funds but to obtain this cash the U.S. Treasury must cut other spending, raise taxes or borrow from the credit markets.
-
Before the pandemic hit, the trustees projected that the combined Social Security trust funds (Old Age and Survivors and Disability) would be depleted in 2035, which would result in an immediate across-the-board benefit cut of 21 percent. The depletion date has likely moved forward as a result of the pandemic. For example, CBO now estimates that the combined trust funds will be insolvent as soon as 2031.
-
In 1960 there were approximately five workers for each Social Security beneficiary. Over the past two decades, the ratio has been closer to three workers for each beneficiary. As the baby boom generation retires, the ratio will shrink to two workers per beneficiary by the 2030s. This means that without placing a larger tax burden on workers or cutting benefits to retirees, the program will incur large deficits.
-
Waiting to address Social Security’s finances will require larger benefit cuts or tax increases, spreading this burden over fewer people, requiring abrupt and less targeted changes, and leaving workers with less time to plan and adjust.
-
For example, according to the Social Security Administration’s trustees report, it would now take an immediate and permanent payroll tax rate increase of 3.14 percentage points (from 12.4 percent to 15.54 percent), or a benefit cut of about 19 percent applied to all current and future beneficiaries to achieve 75-year solvency. Waiting until 2035 to act would require a payroll tax increase of 4.13 percentage points to 16.53 or a benefit cut of 25 percent to maintain 75-year solvency.
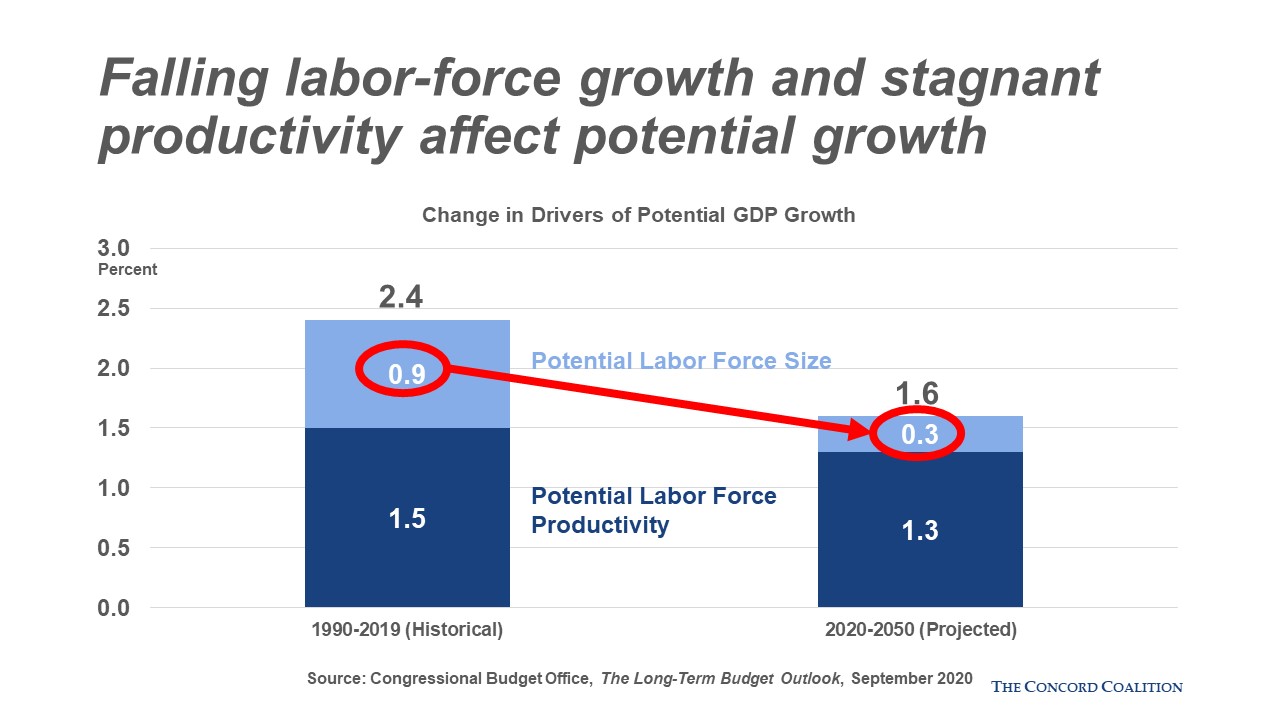
Labor Force Growth and Productivity
The CBO projects that the economy will grow at an average annual rate of just 1.6 percent over the next 30 years (adjusted for inflation). That would be a significant drop from the 2.5 average rate over the past 30 years. As interest costs and mandatory spending continue to grow faster than the economy or the tax base, federal discretionary spending on investments such as education, transportation, research and development, and defense will increasingly be squeezed out.
Candidates should have fiscally responsible plans that budget for critical investments to help grow the economy.
Consider:
-
The growth rate in potential GDP (the maximum possible production of the economy if all resources were fully utilized) is directly linked to a growing labor force and rising productivity. However, over the next decade, CBO projects labor force growth will be just one-third of the recent historical average while productivity growth will be slightly below its average since 1990. This means that achieving growth anywhere near past levels will require new policies that increase the size of the labor force and improve productivity.
-
Federal investments in productivity depend upon adequate funding through the annual appropriations process (“discretionary spending”). In 1970, discretionary spending was about 60 percent of the budget. Mandatory spending (programs that operate on autopilot such as Medicare and Social Security) and interest on the debt are about 40 percent of the budget. In 2019, only 30 percent of the budget was discretionary — compared to 70 percent on mandatory spending and interest.
-
Over the next 10 years, discretionary spending is projected to fall to one quarter of the budget as mandatory spending and interest grow to three-quarters of all spending.
-
Federal investment spending has already been declining for years. Forty years ago the government spent 4.1 percent of GDP and 21 percent of the budget on investments. It now spends only 2.4 percent of GDP and 12 percent of the budget on investments.
Revenues
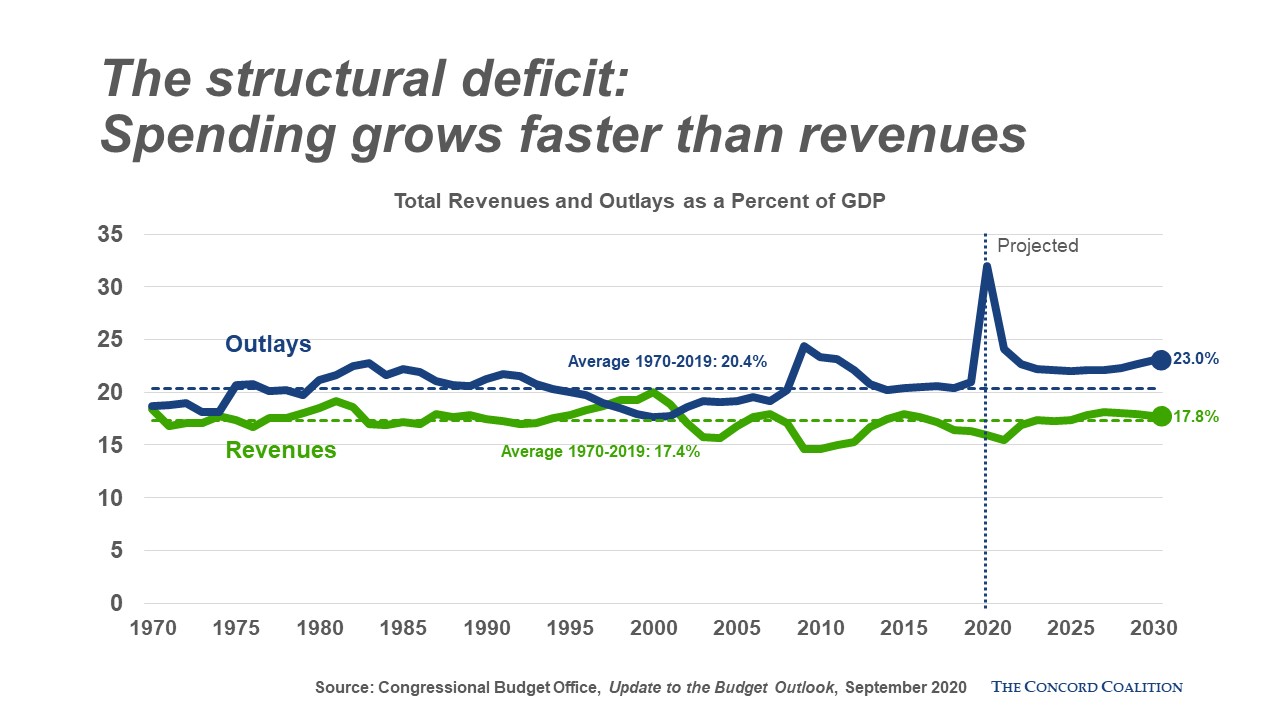
Federal revenues are not keeping pace with expenditures, a trend that will continue as federal spending on health and retirement programs is projected to increase.
Consider:
-
Revenues over the past 50 years have averaged 17.4 percent of GDP. In 2019, however, revenues were 16.3 percent of GDP. Under current policies, revenues are projected to remain below the historical average over the next 10 years.
-
The tax cuts enacted in 2017 are projected to lower revenues by $1.3 trillion over 10 years from what they would have been otherwise even when “dynamically” scored to account for positive economic feedback. Assuming that the cuts currently scheduled to expire in 2025 are extended adds another $974 billion to the revenue loss.
-
Exemptions, deductions, credits and exclusions within the income tax system are often called “tax expenditures” because they are essentially spending programs in disguise. They have much the same impact as if the government had simply written checks to the beneficiaries but these provisions generally receive far less scrutiny than direct spending.
-
Tax expenditures total more than $1.8 trillion a year. That’s equal to more than half of total revenues in 2019 and is far more than all discretionary spending ($1.3 trillion).
-
Reducing the number or scope of these provisions would make the tax code simpler, fairer and more likely to promote economic growth. Because tax expenditures tend to have greater value for upper-income households, it would be possible to reform them in a way that lowers tax rates, retains progressivity and brings in additional revenue to reduce the deficit. A simpler tax code would also be easier to enforce, potentially boosting revenue by hundreds of billions of dollars a year.
Continue Reading