Overview: Doubling the debt
Every year the Congressional Budget Office (CBO) issues a long-term budget outlook covering the next 30 years, assuming no changes in current law. This year’s report was released on September 21 and covered the years 2020 through 2050.
During those years, CBO projects that debt held by the public would double under current law, rising from 98 percent of gross domestic product (GDP) in 2020 to 195 percent of GDP in 2050. According to CBO, “That amount of debt would be the highest by far in the nation’s history, and it would be on track to increase further.”
The updated numbers show a substantial deterioration in the long-term outlook compared to last year’s report, due mostly to the enormous near-term debt resulting from legislative responses to the COVID-19 pandemic. Using the final year of its 2019 report for comparison, CBO now projects that debt held by the public would be 45 percentage points higher in 2049 — 189 percent of GDP compared to 144 percent in last year’s report
“The high and rising path of federal borrowing in CBO’s extended baseline projections would have negative economic consequences over the longer term,” the report says.
Such high levels of public debt would reduce national savings and income, restrain economic growth, increase interest costs, place increasing pressure on important federal programs, and limit the nation’s ability to respond to new and unforeseen challenges.
The magnitude of the problem can be illustrated by CBO’s estimate for what it would take to stabilize debt as a share of GDP over the next 30 years.
To maintain the same relative level of debt in 2050 as we have now (roughly 100 percent of GDP), it would require a cut in spending, an increase in revenue, or some combination of those, totaling 2.9 percent of GDP every year beginning in 2025. That would mean finding $730 billion in savings in the first year alone. Waiting until 2030 to begin these actions would increase the annual amount of deficit reduction needed to keep the debt-to-GDP ratio at 100 percent in 2050 to 3.6 percent of GDP (equivalent to $1.1 trillion in 2030).
Root Causes: Health care, aging and interest on the debt
Spending and revenues are both projected to grow as a share of GDP over the next 30 years, but spending is projected to grow faster than revenues. This structural gap is already apparent in the 10-year budget window.
Between 2019 (the last pre-pandemic year) and 2030, revenues are projected to grow by 1.5 percent of GDP, from 16.3 percent to 17.8 percent. Importantly, this assumes that many tax cuts enacted in 2017 will expire as scheduled after 2025. If those tax cuts are extended, revenues will be more restrained, growing to about 17 percent of GDP in 2030. For context, revenues have averaged 17.4 percent of GDP over the past 50 years.
At the same time, spending is projected to grow by 2.1 percent of GDP, from 21 percent in 2019 to 23.1 percent in 2030. Spending has averaged 20.3 percent of GDP over the past 50 years.
The main cost drivers on the spending side are Social Security and the major health care programs,1 which would grow under current law between 2019 and 2030 by 2.7 percent of GDP from 10.2 percent to 12.9 percent. Spending on those programs would thus grow much faster than revenues even if some of the 2017 tax cuts are allowed to expire. Spending on other programs, including national defense and domestic appropriations, is actually projected to decline slightly as a share of GDP (from 9 percent of GDP to 8 percent in 2030).
Two factors cause Social Security and health care programs to grow faster than the economy: population aging and the rising per-person cost of providing health care. According to CBO, the percentage of the population age 65 and older will expand from 16 percent this year to 22 percent in 2050. As the population ages, there will be more beneficiaries for these programs, which translates into higher overall costs of providing the same level of benefits per person. Adding to this is “excess cost growth” in health care, which is the extent to which the growth of per person health care costs grows faster than potential GDP per person.

Social Security and Medicare have dedicated sources of revenue. For that reason, many people assume that these programs do not present a problem for the federal budget. As CBO makes clear, however, the dedicated resources of these two programs (mostly from payroll taxes and Medicare premiums) do not cover the full amount of benefit payments.
Moreover, the fact that Social Security and Medicare currently have positive trust fund balances tends to obscure the fact that the programs’ cash deficits are a major factor in current and projected deficits. In the long-term update, CBO projects that Social Security’s cash deficit will grow from 0.4 percent of GDP in 2020 to an average of 1.9 percent in 2041-2050. Medicare’s cash deficits grow from 2.0 percent of GDP in 2020 to an average of 4.0 percent of GDP in 2041-2050.
As deficits and debt increase, interest costs on the debt will also add to spending growth even if interest rates remain low. The CBO’s most recent baseline included a major reduction in projected interest rates on federal debt, which lowered borrowing costs by $2.3 trillion over the next 10 years. Even with this adjustment, however, interest grows from 1.8 percent of GDP to 2.2 percent from 2019 to 2030.
Looking beyond the next 10 years, the pattern becomes more pronounced and more troubling.
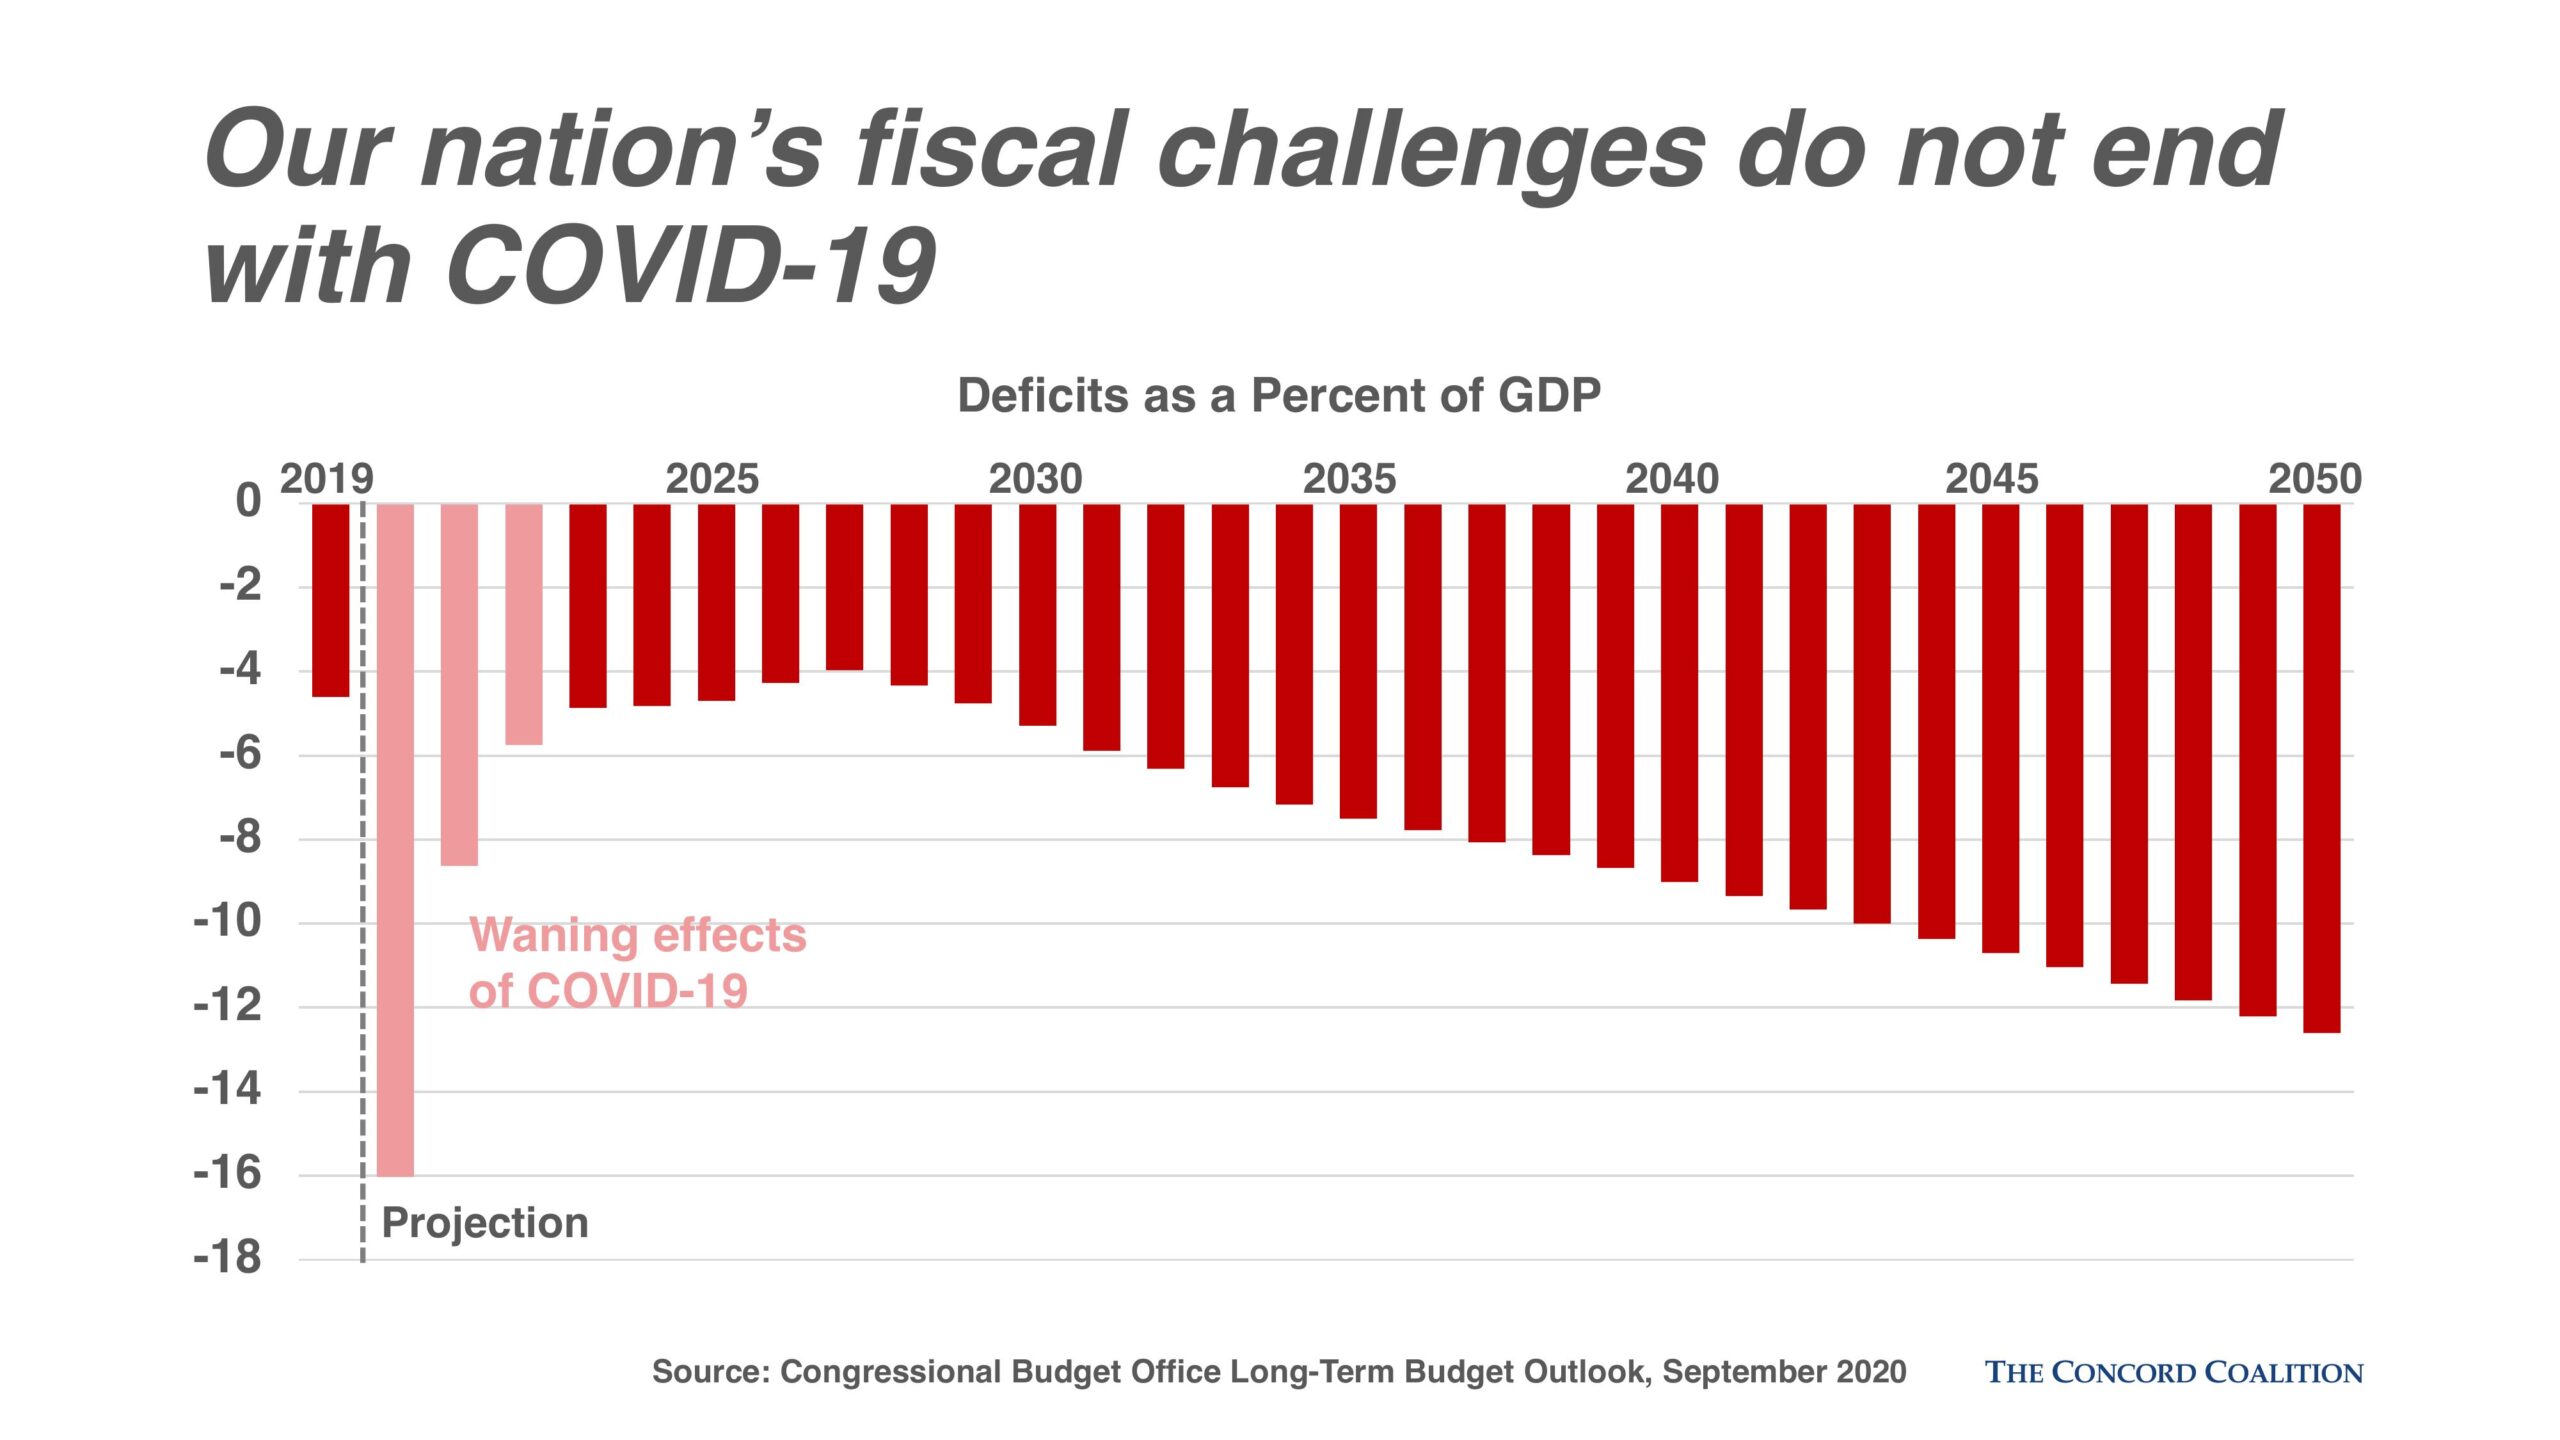
By 2050, CBO projects that revenues would equal 18.6 percent of GDP, assuming no changes in current law, and spending would equal 31.2 percent of GDP. That would push the budget deficit to 12.6 percent of GDP in 2050, more than four times the average over the past 50 years (3 percent of GDP). As noted, debt held by the public would reach 195 percent of GDP in 2050, roughly twice its current level (98 percent of GDP) and the highest in U.S. history.
During the period between 2030 and 2050, major health care programs account for a large share of the spending growth, rising from 6.9 percent of GDP to 9.2 percent. Social Security growth will slow during this period, rising from 6 percent of GDP in 2030 to 6.3 percent by 2050. However, the largest growth comes from interest costs on the debt, which grows from 2.2 percent of GDP in 2030 to 8.1 percent in 2050.

The CBO report demonstrates that much lower projected interest rates on government debt can mitigate but not halt the unsustainable path we’re on. The constant accumulation of massive new debt on an annual basis, long after it may be needed as a COVID-19 response, would eventually overwhelm the effect of low interest rates.
Compounding the projected gap between spending and revenues is the fact that the economy is projected to grow more slowly in the future than it has in the recent past (with the exception of low points during the Great Recession and the current pandemic). The average annual growth rate of inflation-adjusted GDP from 1990 to 2019 was 2.5 percent. Over the next 30 years, CBO projects that growth rate would slow to 1.6 percent under current law and economic assumptions. This is the result not only of rising debt but of slower growth in the labor force and stagnant productivity.
Over the coming decades, CBO projects labor force growth will be about one-third of its 1990-2019 average as baby boomers retire, and that productivity growth will be slightly below its average since 1990. This means that achieving growth anywhere near past levels will require new policies that increase the size of the labor force and improve productivity.

New legislation and slower economic growth make things worse
In response to the COVID-19 pandemic, Congress has enacted four bills this year adding $2.4 trillion to projected deficits over the next 10 years. Mostly because of this new debt, CBO’s estimate of the debt-to-GDP ratio in 2020 has gone from 81 percent to 98 percent. Starting from this higher level boosts projected debt throughout the 30-year outlook.
Three other factors account for the worsening long-term outlook. Revenues are now expected to be lower as a share of GDP; spending is projected to be higher and economic growth is projected to be lower.
According to CBO, the revenue decline is primarily caused by repeal of the so-called “Cadillac Tax” on high-premium employment-based health care plans.2 This, along with other factors such as lower projected economic growth, have reduced CBO’s 2049 revenue projection by 0.9 percent of GDP.
On the spending side, Congress raised discretionary spending higher than assumed in the last report. That raised the “baseline” on which discretionary spending was projected and increased CBO’s projection of long-term discretionary spending by half a percentage point of GDP to 5.6 percent in 2049.
Even with this change, discretionary spending is still projected to gradually shrink as a percentage of GDP because it is assumed to grow no faster than inflation through 2030 and then transition to a growth rate consistent with nominal GDP growth by 2035. Given that discretionary spending has averaged 8.3 percent of GDP over the past 50 years, the assumption that it will fall substantially in the coming years is probably unrealistic.

Another change on the spending side is higher interest on the debt. While CBO revised downward its forecast for interest rates from the 2019 report, the sheer amount of new debt now assumed by CBO pushed projected interest costs higher after 2033. In 2049, CBO’s projection of interest cost is now two percentage points of GDP higher than in last year’s report (5.7 percent versus 7.7 percent).
Rounding out the revised 30-year outlook, CBO lowered its assumption of inflation-adjusted annual GDP growth in the out years of the projection.
Implications for policymakers
The CBO’s new long-term projections are yet another reminder that the United States must pursue broad budget reforms to protect its future, including its economic strength and its position of global leadership.
As the economy slowly regains its footing, attention must focus on stabilizing the debt as a share of the economy. Ignoring our long-term, structural fiscal and economic problems will not make them go away and will not build a political mandate for meaningful action.
The longer we wait, the more difficult the solutions will be — and the greater the risks will be to the nation’s future. It may be many months before policymakers can turn their attention from fighting the pandemic to growing the economy, but it is not too soon to begin thinking about what should be done when that time arrives.
The long-term outlook is useful because it not only shows the magnitude of the problem and the urgency for action, but it also provides a roadmap for the key issues policymakers must confront if they want to achieve better results.
Stronger economic growth would help but projected debt levels are so high that economic growth alone will not be sufficient to put the budget on a sustainable path. And while low interest rates make financing the existing debt easier, they do not prevent an overwhelming accumulation of new debt.
What’s needed is an agenda that both grows the economy and closes the structural gap between spending and revenue growth. This requires policies to slow health care cost growth, make Social Security sustainably solvent, expand the workforce, invest more to enhance productivity, boost worker training and bring in more revenues.
Those who seek the presidency or any other federal office this year should review these new projections carefully and tell the public — as specifically as possible — what they would do to put the budget on a more sustainable path once the current pandemic crisis has passed.
1Major health care programs include Medicare, Medicaid, the Children’s Health Insurance Program and subsidies under the Affordable Care Act.
2Congress repealed this tax in December 2019, reducing projected revenues by $200 billion in the first 10 years and by increasing amounts in the future. During consideration of the Affordable Care Act, CBO suggested that this tax was the legislation’s single most important cost-control effort. While it was initially scheduled to begin in 2018, it was delayed twice and never went into effect.


