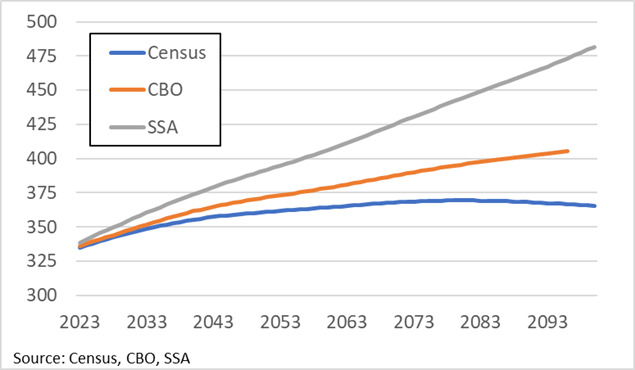
The Census Bureau recently released their latest long-run population projections. Based on their primary demographic assumptions, the number of people living in the United States will rise from 335 million in 2023, reach a peak of 369 million in 2080, and then slowly decline to 366 million by 2100.[1]
Although the Census Bureau is responsible for conducting the decennial census of the U.S. resident population for purposes of Congressional redistricting, they are not the only federal agency that makes long-run population projections.[2] The Social Security Administration (SSA) and the Congressional Budget Office (CBO) also make long-run projections to assist the Social Security and Medicare Trustees and Congress with their actuarial and legislative responsibilities.
A comparison of the population projections by these three agencies reveals some critical differences in their assumptions about births, deaths, and net immigration. These differences result in significant variation in the size and composition of the population. This variation has important implications with respect to the future cost of Social Security and Medicare.
Figure 1 shows the total U.S. population as projected by Census, CBO, and SSA from this year through the end of this century.[3] The Census projections start at a slightly lower level, primarily because they exclude U.S. citizens living outside the 50 states and the District of Columbia.[4] However, the differences in initial starting points are quickly overwhelmed by the differences in projected births, deaths, and net immigration.
Figure 1: Total U.S. Population (Millions)
Changes in the total population reflect the combined effects of births, deaths, and net immigration. When the number of births plus the number of people entering the country exceeds the number of deaths plus the number of people leaving the country, the population will grow. When the reverse is true, the population will decline.
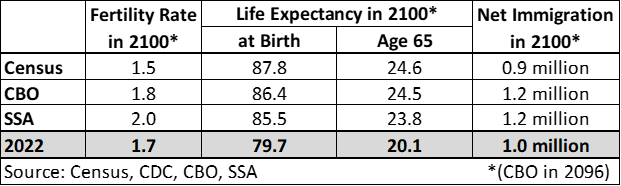
Figure 2 compares the primary demographic assumptions for each agency. Births are measured in terms of the fertility rate which is the average number of children that women are projected to have during their lifetime.[5] Deaths are measured in terms of life expectancy which is the average number of years that people are projected to live, either from birth or age 65. Net immigration is measured in terms of the number of persons that are projected to enter the country minus the number of persons projected to leave the country.[6]
Figure 2: Primary Demographic Assumptions
Although these demographic assumptions may not appear to be appreciably different, even small differences can substantially change the size and composition of the population. Whether the population increases or decreases has important implications for the overall economy and the environment. But from a fiscal policy perspective, the composition of the population is more important than its size.
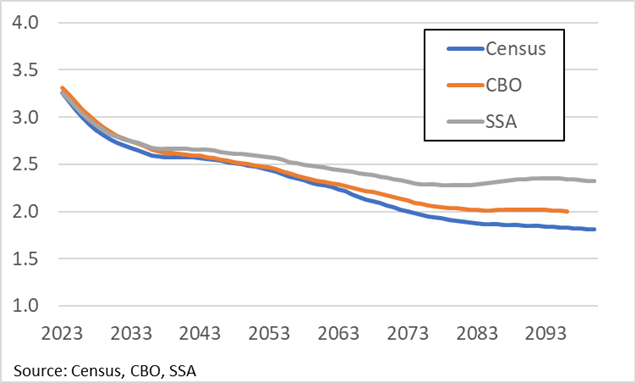
Figure 3 shows the ratio of the working age population (20-64) to the retirement age population (65+). Admittedly, some people between 20 and 64 do not work because of childcare obligations, obtaining a college education, disability, or unemployment, and some people 65 and older do work. Nevertheless, this ratio serves as a useful proxy to illustrate the fiscal policy impact of an aging population.
Figure 3: Ratio of Working Age Population (20-64) to Retirement Age Population (65+)
Social Security and Medicare Hospital Insurance (HI) are primarily funded by a payroll tax collected from workers and their employers. These payroll taxes fund the benefits paid to retired and disabled workers. Thus, the ability to fund benefits is directly related to the ratio of workers to beneficiaries. The higher the ratio, the easier it is to fund benefits, whereas the lower the ratio, the more difficult it is.
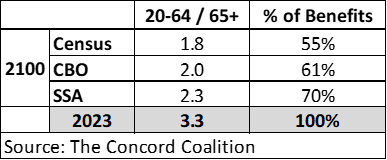
In 2023, there were 3.3 persons between 20 and 64 for every one person 65 or older. By 2100, this ratio is projected to range between 1.8 and 2.3, depending on the demographic assumptions. That means a hypothetical payroll tax that would fund 100 percent of Social Security and Medicare benefits in 2023 would only fund between 55 and 70 percent of benefits in 2100.[7]
Figure 4: Percent of Benefits Payable Under Alternative Demographic Assumptions
Population projections rely on numerous demographic assumptions. These assumptions determine the size and composition of the projected population. The latest projections from the Census Bureau produce a declining population resulting in fewer workers to support each beneficiary. If these projections prove to be correct, our nation’s long-term fiscal outlook is considerably worse than currently projected by CBO and SSA.
_____________________________________________________________________________________________________
[1] 2023 National Population Projections Datasets | (census.gov)
[2] Article I Section 2 | Constitution Annotated | congress.gov; Census in the Constitution | (census.gov)
[3] Trustees Report Single-Year Tables | (ssa.gov) Table V.A3; Budget and Economic Data | (cbo.gov) Demographic Projections, January 2023
[4] The Social Security area population is composed of: (1) residents of the 50 States and the District of Columbia (adjusted for net census undercount); (2) civilian residents of Puerto Rico, the Virgin Islands, Guam, American Samoa, and the Northern Mariana Islands; (3) Federal civilian employees and persons in the U.S. Armed Forces abroad and their dependents; (4) non-citizens living abroad who are insured for Social Security benefits; and (5) all other U.S. citizens abroad. Glossary | (ssa.gov)
[5] For a discussion of the differences between period rates and cohort rates, see What’s Up with Falling Birth Rates? | The Concord Coalition
[6] Fertility Rate (2022) Vital Statistics Rapid Release, Number 28 (June 2023) | (cdc.gov); Life Expectancy (2022) methodstatement23.pdf | (census.gov); Net Immigration (2022) Net International Migration Returns to Pre-COVID-19 Levels | (census.gov)
[7] These calculations assume labor force participation rates are constant and future benefits are proportional to future wages.


