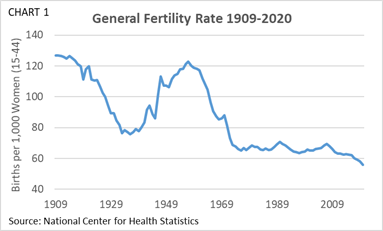
Last week the National Center for Health Statistics (NCHS) released provisional birth data for 2020.(1) Most of the media coverage focused on the fact that the number of births (3.6 million) was the lowest since 1979, and the general fertility rate (the number of births per 1,000 women aged 15 to 44), fell to its lowest level ever recorded (55.8). (2)
Fertility rates are important because they determine how much the total U.S. population will increase or decrease in the future–and population is a key driver of economic growth as well as the levels of government spending and revenue. The fertility rate needed to maintain a constant population is roughly 2.1 births per woman over her lifetime. The number is more than 2.0 because not every woman lives to the end of her childbearing years and there are slightly more boys than girls born each year.(3)
What the media didn’t report is that there is more than one fertility rate. Reporters typically focus on either the general fertility rate or the period fertility rate because they can be measured each year. As noted above, the general fertility rate is the annual number of births regardless of the mother’s age divided by the number of women between the ages of 15 and 44. The period fertility rate is the sum of the annual age-specific birth rates (i.e. births to mothers at each age divided by women at each age).
The other fertility rate, which is known as the cohort rate, wasn’t reported because for most women it hasn’t happened yet. Unlike the period rate that counts annual births to women of all ages in a single year, the cohort rate counts births that occur over the lifetime of women born in the same year. This measure can only be determined after all the women born in any given year have reached the age at which no additional births are expected to occur. Today’s younger women have not reached the end of their childbearing years, so their cohort rate is still unknown.
What demographers want to know is the number of children women will have over their lifetime, which is the cohort rate. Because this number cannot be observed contemporaneously, the period rate is sometimes used as a crude proxy by assuming women in the future will have the same number of births at each age as women in the present. But this hypothetical assumption can be misleading.
Chart 2 shows the period fertility rate for women aged 12 to 55 each year from 1933 to 2019 and the cohort fertility rate for women born each year from 1921 to 2007 (i.e. aged 12 from 1933 to 2019).(4) The period rate can be either higher or lower than the cohort rate. The two rates are equal only when the number of births per woman at each age remains constant over time.

When the two rates diverge, it indicates a change in the timing of when women have children (tempo effect), a change in the desired number of children (quantum effect), or both. The table below provides an example of the tempo effect when the desired number of births remains constant, but the age at which births occur rises over time.
All women (15-44) in period 1 want to have an average of 2 births spaced evenly throughout their expected years of motherhood. Adding up the births that occur at each age in period 1 produces a period rate of 2 births per woman. As the women in period 1 grow older and move through periods 2 and 3, (blue squares) the cohort rate is also 2 births per woman.

Beginning in period 2, younger women (15-24) decide they want to have fewer births when they are younger and more births when they are older, but still have 2 births overall. Adding up the births that occur at each age in period 2 produces a period rate of 1.67 births per woman. As the women in period 2 grow older and move through periods 3 and 4 (green squares), they begin to make up for the births they postponed at younger ages. In period 3, the period rate rises to 1.83. By period 4, the transition to the new birth pattern is complete and the period rate and cohort rate are both equal to 2 births per woman.
The example presented in the table above is consistent with recent data showing a decline in births at younger ages and a rise in births at older ages. However, it is still too early to tell whether younger women are merely postponing having children until later, or whether they intend to have fewer children. One recent study suggests the latter.(5) Even if younger women expect to have more children at older ages, it is uncertain whether they will be able to fulfill their expectations given the ability to have children declines with age.(6)
The good news is current birth rates as typically reported can be a misleading indicator of future birth rates. The bad news is we won’t know the real story until it happens later.
[1] Vital Statistics Rapid Release, Number 012 (May 2021) (cdc.gov)
[2] Table 1-1. Live Births, Birth Rates, and Fertility Rates, by Race: United States, 1909-2003 (cdc.gov); Homepage – Health, United States – Products (cdc.gov)
[3] National Vital Statistics Reports, Vol. 53, No. 20, (6/14/2005) (cdc.gov)
[5] Will Women Catch Up to Their Fertility Expectations? (bc.edu)


