The latest Social Security and Medicare Trustees’ reports released earlier this week appear to contain a modicum of good news. The trust fund exhaustion dates have been delayed a year for Social Security (2035 instead of 2034) and five years for the Medicare Hospital Insurance (HI) program (2036 instead of 2031). But underneath the headlines the fundamental problem remains. Both programs face a future of rising costs that far exceed the funds available to pay them. This funding shortfall will result in reduced benefits and diminished access to healthcare, unless Congress and the President take action.
Although most of the media coverage has focused on the modest delay of the impending exhaustion of the Social Security and Medicare HI trust funds, as The Concord Coalition has previously noted, trust funds merely provide the legal authority to pay benefits. What matters from a federal budget perspective is the amount of dedicated revenue available to pay benefits. In the case of Social Security, that’s the 12.4 percent payroll tax, and income taxes on up to 50 percent Social Security benefits. In the case of Medicare, that’s the 2.9 percent payroll tax, the 0.9 percent surcharge, beneficiary premiums, income taxes on up to 85 percent of Social Security benefits, fees on drug companies, and payments from the States for dual Medicare-Medicaid beneficiaries.
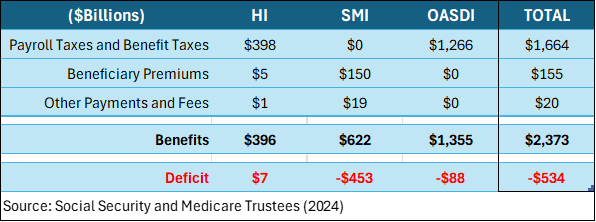
Last year the Social Security (OASDI) program spent $88 billion more than it collected from dedicated revenue sources and the Medicare (HI+SMI) program spent $446 billion more than it collected from dedicated revenue sources. On a combined basis the programs spent $534 billion, or 29 percent, more than collected. The shortfall must be paid out of general revenue. When the federal budget is running a deficit, as it usually is, that means more borrowing from the public, which adds to the federal debt.
Figure 1: Social Security and Medicare Revenue and Expenditures in 2023

Unfortunately, the shortfall between dedicated revenue and benefits will continue to grow in the future. According to the latest trustees’ reports, the annual shortfall will rise from 2.1 percent of GDP in 2023 to 4.3 percent of GDP in 2053. That’s equivalent to $1.2 trillion in today’s dollars.
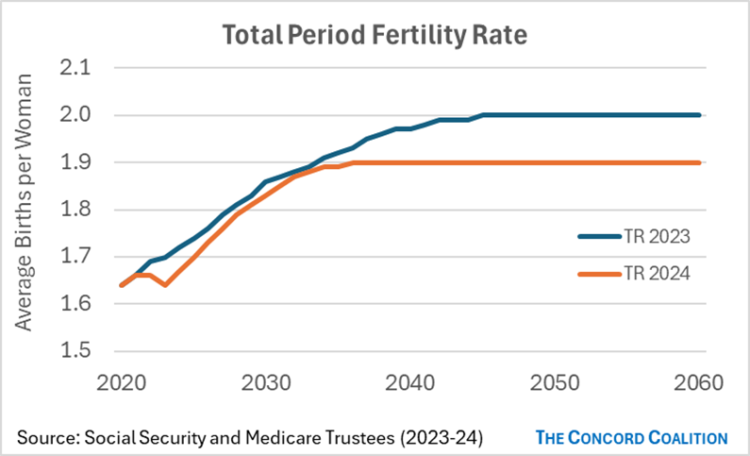
The other news in this year’s Trustees’ reports was their decision to lower the ultimate fertility rate assumption from 2.0 to 1.9 lifetime births per woman. Although fertility rates have been falling almost continuously since 2007, and reached an historic low of 1.62 last year, the Trustees had previously insisted the fertility rate would return to 2.0, which is just below the 2.1 rate needed to maintain a stable population. Despite their latest decision to lower the rate, the Trustees also adopted a new methodology that assumes birth rates will rise faster than their previous methodology, largely offsetting the lower rate through the end of the next decade.
Figure 2 compares the total (period) fertility rate assumed in the 2023 reports with the rate assumed in the 2024 reports. It shows birth rates are projected to recover more quickly from an even lower level than was previously assumed.
Figure 2

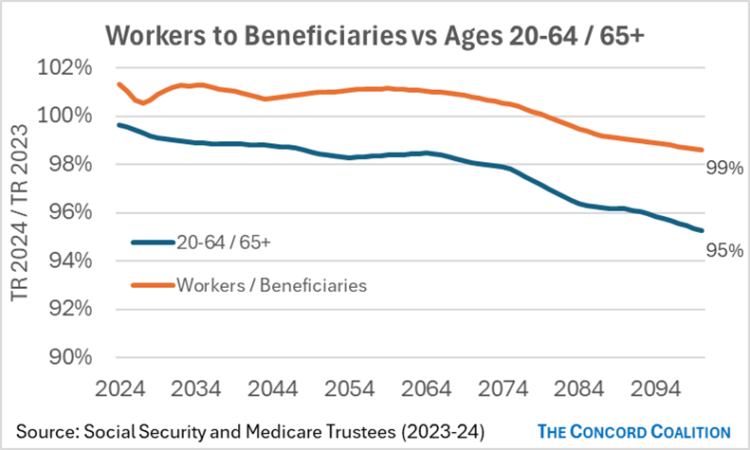
The Trustees also assumed higher labor force participation rates, relative to last year’s reports. Without this change, the lower fertility rate would have resulted in fewer workers available to pay for each beneficiary. By assuming individuals are more likely to remain employed, especially at older ages, the ratio of workers to beneficiaries will decline less than the ratio of the working-age population (20-64) to the retirement age population (65+).
Figure 3 compares the change in these two ratios from the 2023 reports to the 2024 reports. Specifically, the 20-64 / 65+ ratio and the workers / beneficiaries ratio in the 2024 reports are each divided by the corresponding ratios in the 2023 Trustees’ reports. The population ratio declines by 5 percentage points, due to declining birth rates; whereas the employment ratio increases and then decreases by 1 percentage points, due to increased labor force participation. Thus, higher employment largely offsets lower fertility.
Figure 3

The Social Security and Medicare Trustees’ reports rely on numerous economic and demographic assumptions to make projections about the future financial status of these programs. As the examples above illustrate, these assumptions can often have offsetting effects. Moverover, the length and speed of the transition from current levels to ultimate (“steady-state”) levels can amplify or mitigate the financial impact.
Despite the inherent uncertainty surrounding these assumptions, there is no plausible scenario that would eliminate the growing gap between scheduled benefits and the dedicated funds available to pay them. Closing this gap will require congressional and presidential action. Unfortunately, policymakers are missing in action.


