Part 2: College Students
Introduction
President Biden’s FY 2022 Budget proposes to spend nearly $1.7 trillion over the next ten years on several new or expanded entitlement programs for children, college students, the elderly, and the disabled. The budget also contains various tax increases intended to pay for these programs. But the possibility exists that these programs will cost more than projected, and the taxes will generate less revenue than projected, or both.
In this series of issue briefs, we examine the inherent budgetary risk associated with the creation of new entitlement programs. Specifically, we provide estimates that reflect the potential cost of universal participation, recognizing there is some uncertainty regarding average cost per participant. These estimates suggest the cost of these programs could easily exceed the President’s request, thereby jeopardizing his commitment to pay for them.
The President’s Budget Request for College Students
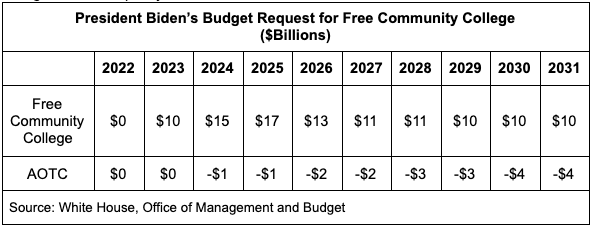
The President’s budget contains several proposals related to college students, including free community college; tuition grants for Historically Black Colleges and Universities, Tribal Colleges and Universities, and other minority-serving institutions; college completion grants; and expanded Pell Grants. The budget requests $265 billion for these programs over the next ten years (2022-2031). This total was reduced by $20 billion to reflect the interaction between free community college and the American Opportunity Tax Credit.
Free Community College
The President’s proposal would “ensure that first-time students and workers wanting to reskill can enroll in a community college and earn a degree or credential for free.”[1] Specifically, the federal government would partner with States and tribes to waive tuition and fees for about 5.5 million students.[2]
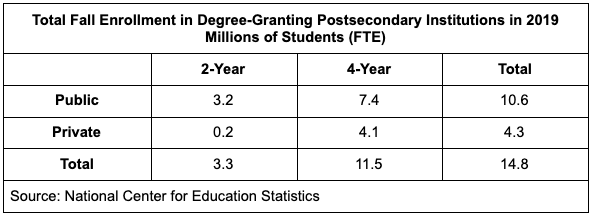
According to the College Board, average tuition and fees for full-time, in-district students at two-year public institutions in 2019-2020 was $3,730 per year.[3] Total enrollment at two-year public institutions was 5.4 million in 2019.[4] That’s equal to 3.2 million students on a full-time equivalent (FTE) basis.[5] Thus, total tuition and fees would cost $12 billion per year in terms of FTE students.[6]
If the waiver of tuition and fees encourages more students to attend community college, the cost would be substantially higher. According to one study, nearly half of all students who completed a bachelor’s degree at a four-year institution in the 2015-2016 academic year had been enrolled at a two-year public institution at some point in the previous 10 years.[7]
The FTE enrollment in four-year institutions (11.5 million) is more than three times the FTE enrollment in two-year institutions (3.3 million).[8] If everyone who ultimately attends a four-year institution initially attends a two-year institution, the cost could be as much as $21 billion per year.[9]

Increasing educational attainment among lower-income students would require financial assistance beyond free tuition and fees, especially for those living in areas of the country where there are no public colleges within a reasonable commuting distance (60-minute drive), so-called “education deserts.”[11] Likewise, students who do not live at home with their parents would need housing assistance to avoid working full-time and allow them to complete their two-year degree on time.[12]Of course, if removing financial barriers for students who could not otherwise afford to attend community college is the intended goal, then waiving tuition and fees is not enough. According to the College Board, tuition and fees ($3,730) account for only 20 percent of the total cost of attendance. Room and board ($8,990), books and supplies ($1,460), transportation ($1,840), and other expenses ($2,400) account for the other 80 percent.[10]
The President’s budget requests substantially less than the amount needed to waive tuition and fees for all potentially eligible students, much less to fund the ancillary expenses many low-income students would likely require. Although the states and tribes are required to provide some additional funds, the amount is not specified in the budget. The budget also includes savings from the American Opportunity Tax Credit (AOTC). Under current law, the AOTC allows eligible taxpayers to claim a $2,500 tax credit for qualified education expenses.[13] Students receiving free tuition and fees would not claim those expenses under the AOTC. Presumably, the same limitation would apply to the Lifetime Learning Credit and the tuition tax deduction, but the budget does not specify that result.

Fund Advancing Affordability for Students
The President’s proposal would provide two years of subsidized tuition and fees for students from families earning less than $125,000 enrolled in a four-year Historically Black College and University (HBCU), Tribal College and University (TCU), or Minority-Serving Institution (MSI).[14]
According to the Center for MSI’s at Rutgers University and the Integrated Postsecondary Education Data System, there are 531 four-year, minority serving institutions.[15] Based on FTE undergraduate enrollment (3.6 million), the cost of providing two years of tuition and fees ($10,478) to students attending these institutions would be nearly $19 billion per year.[16] Adjusting for the share of students with family income below $125,000 would reduce the annual cost to roughly $12 billion.[17]
In contrast, the President’s budget provides an average of roughly $4 billion per year (2022-2031). The proposed subsidy may not be intended to fully cover the total cost of tuition and fees, or the proposal may assume the States and Tribes will make up any shortfall in the federal subsidy.

College Completion Grant
The President’s proposal would provide grants to States and Tribes to support “a comprehensive set of completion and retention activities at colleges and universities that serve high numbers of low-income students.”[18] Such activities include faculty and peer counseling, mental health services, childcare, transportation, emergency financial assistance, food and housing assistance, career coaching and networking, career pathways, and improving transfer student success.[19]
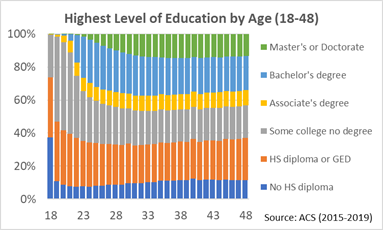
According to the American Community Survey (ACS), about 90 percent of young adults graduate from high school (or obtain a GED), nearly two-thirds attend college, and less than one-half earn an Associate’s degree or higher.[20] Overall, about 70 percent of those who attend college ultimately earn a degree. Because the ACS is a representative sample of all adults, this rate is higher than the institutional data showing 60 percent of first-time college students earn a certificate or degree within eight years of initial enrollment.[21]

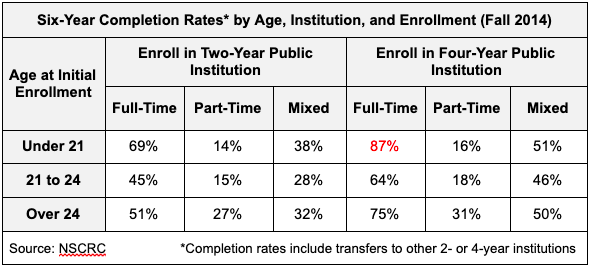
College completion rates vary between two-year and four-year institutions, younger and older students, and full-time and part-time enrollment. Students who attend a four-year institution on a full-time basis immediately after high school are much more likely to graduate within six years.[22]

In general, college students need 60 credits for an Associate’s degree, and 120 credits for a Bachelor’s degree. If students earn fewer than 15 hours per semester, they will not graduate on time – that is within two-years and four-years, respectively. In 2019, less than 60 percent of college students were enrolled full-time.[23]
Moreover, many students arrive on campus unprepared for college level work. As a result, they spend more time and money than necessary to earn a degree, if they graduate at all. Among first-year undergraduates in 2015-2016, more than one-third of full-time students, and nearly one-half of part-time students took one or more remedial education courses.[24] In addition, between 30 and 24 percent of first-time students at two-year and four-year institutions, respectively, transfer to another institution.[25] According to a recent study of transfer students from two-year institutions, approximately one-third transferred all their credits, one-third lost all their credits, one-third were somewhere in between.[26]
The President’s proposal would spend $6 billion per year on completion and retention services. It’s not clear how many more students would graduate under these proposals or even whether there is an aspirational goal. Nor is it clear how effective these services will be, regardless of the amount of spending, because they fail to address the fact that too many students enter college unprepared. Thus, students would be at risk of exhausting their two-years of free tuition before they ever graduate, unless they arrive on campus better prepared to engage in full-time college level work.

Expanded Pell Grants
The federal Pell Grant program provides up to $6,495 per academic year (2021–2022) to undergraduate students based on their financial need.[27] Students who enroll during the summer may receive an additional grant of up to 50 percent of the maximum amount. Students are eligible to receive a grant for no more than the equivalent of twelve full-time semesters.[28] The President’s proposal would increase the maximum amount to $8,370 in 2022-2023, which the budget describes as “a significant down payment on the President’s commitment to doubling the grant.”[29]
According to the Department of Education, about 6.5 million students are projected to receive $28 billion in Pell Grants in 2021.[30] Doubling the maximum grant would cost $56 billion per year assuming no changes in participation rates or choice of institution. But a larger grant would expand eligibility to higher income families, attract and retain more eligible students, and expand enrollment options to more expensive institutions. Each of these factors would increase the cost even more.
For example, students who are considered financially independent from their parents (e.g. age 24 or older, married, or served in the military) qualify for a Pell Grant based on their own income and assets.[31] These independent students account for a majority of Pell Grant recipients, even though they are less likely to participate.[32] Increasing the participation rate among independent students to equal that of dependent students with the same family incomes would increase the annual cost of doubling the maximum Pell Grant to $70 billion. Increasing the participation rate to 100 percent among both categories of students would increase the annual cost to more than $90 billion.[33]
Rather than doubling the maximum Pell Grant, the President’s budget provides for increasing the maximum amount to $8,370, which is projected to cost about $9 billion per year. Relative to the potential cost of permanently doubling the maximum amount, that’s only a 10 percent down payment.

Conclusion
The President’s FY 2022 budget proposes several new or expanded entitlement programs, along with various tax increases. Although it’s unlikely every eligible beneficiary will fully participate, data show these programs could cost significantly more than the additional revenue available to pay for them. Once an entitlement program is enacted, it becomes very difficult to scale back. In the interest of full disclosure and fiscal responsibility, the Administration should provide Congress with the assumptions, data and methods used to project the cost of these programs. Moreover, the Administration should agree to limit participation, or spending per participant, to ensure costs do not exceed available revenue.
* * *
This is the second report in a three-part series that examines the potential budgetary impact of several key provisions of President Biden’s “Build Back Better” agenda. The other reports in this series can be found at the links below:
The Potential Cost of New Entitlements | Concord Coalition (Part 1: Children)
The Potential Cost of New Entitlements Concord Coalition (Part 3: Elderly and Disabled)
[2] Ibid
[3] Trends in College Pricing 2019 (collegeboard.org)
[6] 3.2 million x $3,730 = $11.9 billion
[8] Digest of Education Statistics, 2019 – Appendix B: Definitions; FTE = 12 or more credits per semester
[9] (11.5 million / 2) x $3,730 = $21.4 billion
[10] Trends in College Pricing 2019 (collegeboard.org)
[11] Who Lives in Education Deserts? More People Than You Might Think (chronicle.com)
[12] DataPoints_No21.pdf (nche.edu)
[13] The American Opportunity Tax Credit: Overview, Analysis, and Policy Options (congress.gov)
[15] Rutgers GSE CMSI – MSI Directory and The Integrated Postsecondary Education Data System
[16] (3.6 million / 2) x $10,478 = $18.8 billion
[17] MDAT (census.gov) Nearly two-thirds of high school seniors have family income below $125,000.
[19] Ibid
[20] MDAT (census.gov)
[21] Completing College – National Student Clearinghouse Research Center (nscresearchcenter.org)
[22] Ibid, National Appendix (xlsx)
[23] Total fall enrollment in degree-granting postsecondary institutions, by level of enrollment, control and level of institution, attendance status, and age of student: 2019 (ed.gov) Note that “full-time” is defined as “at least 75 percent of the normal full-time course load.” (15 credits x 75% = 12 credits). That means a “full-time” student would graduate in either 2.5 or 5 years.
[27] The amount of the maximum grant that students receive is based on their income and assets relative to their tuition and fees. Specifically, the amount received is the lesser of – (1) the Maximum Pell Grant minus their expected family contribution (EFC), or (2) the Maximum Pell Grant minus the cost of attendance (COA).
[28] Federal Pell Grant Program of the Higher Education Act: Primer (congress.gov). Full-time is defined as 12 credits per semester.
[30] Ibid
[31] Federal Student Aid: Need Analysis Formulas and Expected Family Contribution (congress.gov)
[32] Federal Pell Grant Program End-of-Year Report and Other Annual Data Reports
[33] Percentage of undergraduates receiving financial aid, by type and source of aid and selected student characteristics: 2015-16 Concord Coalition calculations based on the distribution of students in 2015-2016.
Continue Reading


