Download the pdf: The Fiscal Gap_ Useful Metric or Misleading Indicator
Introduction
The persistent shortfall between taxes and spending results in a rising level of government debt. Preventing the debt from reaching an unsustainable level will require Congress to address the shortfall through some combination of higher taxes and lower spending. One common metric that is often used to estimate the magnitude of the policy changes needed to address the shortfall is the “fiscal gap.”
The fiscal gap is a summarized measure of the government’s projected budgetary shortfall over a specified period of time. This measure attempts to convey through a single number the answer to an important question: How much does Congress need to raise taxes or reduce spending to achieve the desired level of debt at the end of the projection period? Unfortunately, the answer provided by the fiscal gap is not as useful as it seems.
This issue brief explains how the fiscal gap is calculated, examines why it provides misleading and unrealistic results from a budgetary and public policy perspective, and suggests how it can be improved.
Calculating the Fiscal Gap
The fiscal gap is often presented as a useful way to measure the gap between taxes and spending and determine the magnitude of the fiscal policy changes needed to address the shortfall.[1] However, the fiscal gap calculation relies on assumptions and methods that limit its usefulness as a guide to public policy decisions. To understand these limitations, it is necessary to explain how the fiscal gap is calculated.
The fiscal gap is a summarized measure of the government’s budgetary shortfall expressed as a single net number (i.e., inflows minus outflows). This number is based on projected values for taxes, spending, debt, and Gross Domestic Product (GDP) over a specified future period.[2] To compute the fiscal gap, the projected (future) values for each category are converted into present values (PV) by dividing them by the compound interest rate on government debt and then adding the results to obtain the total for each category.[3]
The “spending” category refers to programmatic spending, which excludes interest on the debt, and the “debt” category refers to publicly held debt.[4] Interest is not included as a separate category because converting the other categories into PVs already takes interest into account. The fiscal gap accounts for the previous shortfall between taxes and spending by including the current level of debt. Policymakers must specify the desired level of debt at the end of the projection period to complete the calculation. The fiscal gap can be expressed by the following formula:
Fiscal Gap = (PV Taxes – PV Spending – Current Debt + PV Future Debt Target) / PV GDP.
If policymakers wanted to repay the current debt, then the future debt target would be zero. However, policymakers are unlikely to go that far and would more likely propose a number larger than zero.
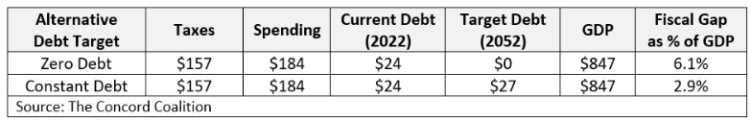
Figure 1 shows the components of the fiscal gap under two alternative scenarios based on the Congressional Budget Office’s (CBO) long-term budget outlook for the 30-year period from 2023 and 2052.[5] Under the first scenario, the publicly held debt is repaid by the end of the period, and the fiscal gap is 6.1 percent of GDP. That means the policy changes needed to repay the debt would be equivalent to increasing taxes across-the-board by 33 percent or reducing spending across-the-board by 28 percent in every year throughout the entire period.[6]
Under the second scenario, the publicly held debt in 2052 is the same as in 2022, measured as a percent of GDP, and the fiscal gap is 2.9 percent of GDP. That means the policy changes needed to achieve the same level of debt would be equivalent to increasing taxes across-the-board by 15 percent or reducing spending across-the-board by 13 percent in every year throughout the entire period.[7] These percentages would be equivalent to a $741 billion tax increase or a $699 billion spending decrease in 2023.
Figure 1: Components of Fiscal Gap under Alternative Debt Targets in Trillions of Present Value Dollars (2023-2052)
Achieving the debt target shown in the two scenarios above rely on the assumption that Congress would enact immediate and permanent policy changes beginning in 2023. This assumption can be modified to delay the changes to a subsequent year, but the longer the delay, the larger the changes would need to be.
Limitations of the Fiscal Gap
The fiscal gap calculation appears to provide policymakers with a useful metric to guide their decisions. However, the calculation does not adequately account for the projected path of future deficits or the politics of major tax and spending decisions. As a result, the fiscal gap provides misleading and unrealistic results from a budgetary and public policy perspective.
The fiscal gap measures the average shortfall over the entire projection period. When annual deficits are rising throughout the projection period, closing the gap means short-term surpluses offset long-term deficits enough to achieve the desired level of debt at the end of the period, but that level is not sustainable. This result is equivalent to assuming you can safely wade across a river with an average depth of three feet (i.e., fiscal gap) and a sandbar in the middle (i.e., debt target), without acknowledging the river is nine feet deep on the other side of the sandbar (i.e., long-term deficits). Closing the fiscal gap is portrayed as a measure of the immediate and permanent policy change needed to stabilize the debt; however, the result is not permanent when deficits continue to rise throughout the projection period and beyond.
Moreover, an immediate policy change of the requisite size would be politically untenable. Congress would never take such precipitous action. Politicians routinely express opposition to reducing benefits for current Social Security and Medicare beneficiaries. To the extent there is any support for such reductions, it is limited to future beneficiaries. Policymakers also recognize that significant policy changes should not be made too abruptly. Taxpayers and program beneficiaries should be given adequate time to make plans and adjust to the changes. Thus, a more realistic scenario is to assume Congress would phase in the necessary changes gradually over time.
To examine how the path of future deficits and the timing of policy changes affect the results, the next section of the issue brief illustrates two alternative ways to address the projected budgetary shortfall.
Comparing Alternatives
Economists generally agree rising levels of debt pose significant risks to the federal budget and the economy. However, there is no easy way to determine how much debt is too much, or when an otherwise sustainable level of debt might become unsustainable due to changing circumstances. Given the inherent uncertainties, this issue brief does not attempt to recommend the most appropriate level of debt. For illustrative purposes, it merely assumes policymakers choose the current level of debt as the desired target.
Under CBO’s projections, the publicly held debt will rise from 98 percent of GDP in 2022 to 185 percent in 2052. To achieve the same level of debt in both years, policymakers could take two approaches. As shown in Figure 1 above, closing the fiscal gap with a constant debt target would require an immediate and permanent policy change equivalent to 2.9 percent of GDP. Alternatively, policymakers could phase in the necessary changes gradually over time. These changes would be much smaller in the beginning, less than 1 percent of taxes or spending, but much larger at the end, about 25 percent or 30 percent of taxes or spending, respectively.
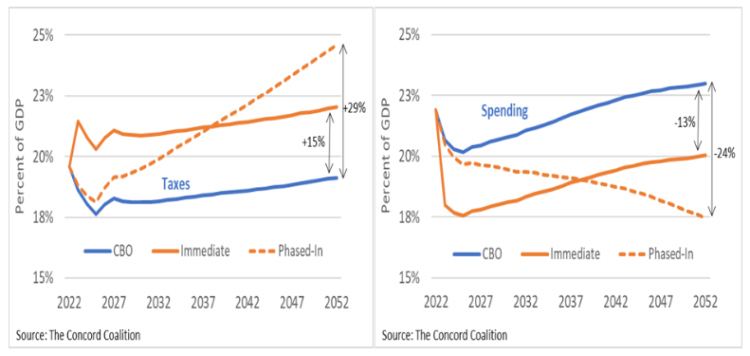
Figure 2 compares the policy changes under each approach relative to CBO’s projection of taxes and spending. The left side shows the tax increases, and the right side shows the spending decreases needed to achieve a level of debt equal to 98 percent of GDP in 2052. Assuming the changes were implemented immediately, taxes would be 15 percent higher, or spending would be 13 percent lower throughout the entire period. Assuming these changes were implemented gradually, they would be negligible at the beginning of the period. However, taxes would be 29 percent higher, or spending would be 24 percent lower by the end of the period.
Figure 2: Tax and Spending Changes Needed to Achieve Debt Target under Alternative Policies
Both approaches achieve the same level of debt in 2052, but they impose different burdens over time. Immediate policy changes impose a proportional burden throughout the entire period, whereas gradual policy changes shift most of the burden to the end of the period. These differences are also reflected in the level of deficits and debt.
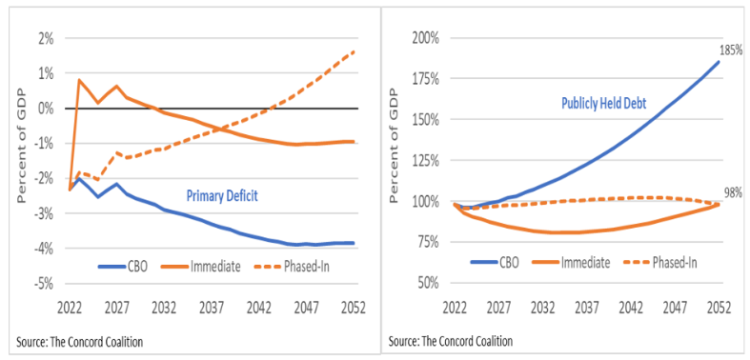
Figure 3 compares primary deficits and publicly held debt under the two alternatives. The left side shows the change in deficits, and the right side shows the change in debt. Immediate policy changes would result in short-term surpluses followed by long-term deficits, whereas phased-in policy changes would result in short-term deficits followed by long-term surpluses. As a result, the level of debt is rising at the end of the period under the immediate policy changes, whereas the level of debt is falling at the end of the period under the phased in policy changes.
Figure 3: Primary Deficits and Publicly Held Debt Under Alternative Policies
The difference in debt trajectories between the two alternatives is due to the interaction between the projected path of future deficits and the nature of the fiscal gap calculation. CBO projects the deficit is rising throughout most of the 30-year period. The fiscal gap measures the average deficit over the entire period. When future deficits are larger than current deficits, policy changes that merely close the fiscal gap do not stabilize the debt.
Actuarial Balance and Sustainable Solvency
The fiscal gap is analogous to Social Security’s actuarial balance.[8] Both measures reflect the average shortfall during a specified period. Closing the fiscal gap or achieving actuarial balance is only designed to achieve the specified goal in the final year of the projection period (i.e., the targeted level of debt as percent of GDP, or a positive trust fund balance equal to the cost of annual benefits in the final year). Closing the fiscal gap does not prevent rising levels of debt, just like achieving actuarial balance does not prevent trust fund depletion.
To overcome the limitations of the actuarial balance calculation, the concept of sustainable solvency was developed. According to the Social Security Trustees:[9]
“If the projected trust fund ratio is positive throughout the period and is either level or increasing at the end of the period, then projected adequacy for the long-range period is likely to continue for subsequent reports. Under these conditions, the program has achieved sustainable solvency.”
This concept could also be applied to the fiscal gap calculation. Rather than focusing on the average shortfall over the entire period, policymakers need to consider the projected path of annual deficits within the period. Only when the level of debt is stable or falling at the end of the period would the budget be considered fiscally sustainable.
Conclusion
The fiscal gap is a summarized measure of the projected shortfall between taxes and spending over a specified period of time. This measure is often portrayed as a useful metric to determine the magnitude of the immediate and permanent policy changes needed to address the shortfall. However, the fiscal gap is a misleading indicator from a public policy and budgetary perspective.
From a public policy perspective, the fiscal gap relies on the implausible assumption that Congress would enact immediate across-the-board policy changes. From a budgetary perspective, the fiscal gap conveys the misleading impression that it would permanently maintain the desired level of debt.
To achieve a sustainable fiscal policy, policymakers must adopt a more gradual approach to implementing policy changes, while recognizing the need to ensure these changes are sufficient to avoid rising levels of debt.
[1] Calculating the Fiscal Gap | (cbo.gov)
[2] The fiscal gap can be extended into perpetuity (infinite time horizon). See: Fiscal Futures, Institutional Budget Reforms, and Their Effects: What Can Be Learned? (oecd.org); Fiscal Sustainability Report 2021 (europa.eu)
[3] PV = FV/(1+r)^n, where FV is the future value, r is the interest rate, and n is the number of years from the present to the future.
[4] In this issue brief, the “public” refers to both foreign and domestic investors, including the Federal Reserve. Debt held by government trust funds like Social Security and Medicare is not included. See the Appendix, Passing the Buck: How The National Debt Burdens Future Generations | Concord Coalition
[5] The 2022 Long-Term Budget Outlook | (cbo.gov)
[6] ($847 * 6.1%) / $157 = 33% and ($847 * 6.1%) / $184 = 28%
[7] ($847 * 2.9%) / $157 = 15% and ($847 * 2.9%) / $184 = 13%
[8] The Future Financial Status of the Social Security Program | (ssa.gov)
Continue Reading