Download the pdf: Social Security: A New Solution to an Old Problem
Introduction
More than one-quarter of state and local government employees are exempt from Social Security because they participate in a pension plan that allegedly provides comparable retirement benefits.[1] Despite their exemption, most of these employees will become eligible for Social Security, either as the spouse of a covered worker or from working in covered employment before, during, or after their own non-covered employment.
The Government Pension Offset (GPO) and the Windfall Elimination Provision (WEP) were enacted to maintain parity between covered and non-covered workers by reducing or eliminating Social Security benefits paid to individuals who receive a pension based on non-covered employment. These provisions have generated strong opposition from affected individuals. While some criticism is justified, the two provisions serve a legitimate purpose. Repealing them would be costly and inequitable, as explained in a previous issue brief.[2]
This issue brief examines several proposals to improve the coordination of Social Security benefits with non-covered pensions and concludes a “sliding scale” formula would more accurately and consistently achieve the intended goal.
Dual Entitlement Rules and Progressive Replacement Rates
The GPO and WEP were enacted to maintain parity between covered and non-covered workers with respect to the receipt of multiple benefits and the level of progressivity.
Social Security beneficiaries eligible to receive a retirement benefit and an auxiliary spousal or survivor benefit are subject to the dual entitlement rule, which offsets one benefit against the other, effectively paying them the larger of the two. For non-covered workers, the GPO serves as a proxy for this rule by reducing auxiliary benefits by two-thirds of any non-covered pension paid in lieu of a Social Security retirement benefit.[3]
The WEP serves a different purpose. Social Security provides higher replacement rates to lower-wage workers, which means they receive a larger benefit as a share of their wages than higher-wage workers. Because benefits are based on the average of the highest 35-years of covered wages, workers with fewer years of covered employment have a lower average wage, resulting in higher replacement rates. For covered workers, higher replacement rates compensate for years they did not work due to periods of unemployment or providing care to their children or elderly parents. For non-covered workers, however, higher replacement rates would (absent the WEP) compensate for years they earned a non-covered pension. The WEP serves to offset this unintended “windfall” by reducing replacement rates for individuals with non-covered pensions based on the number of years of substantial covered earnings.[4]
However, the GPO and WEP do not accurately and consistently equalize the treatment of covered and non-covered workers. Therefore, other alternatives should be considered to replace them.
Comparing Alternatives
The goal of the GPO is to duplicate the dual entitlement rule. The goal of the WEP is to equalize replacement rates between covered and non-covered workers. However, Social Security and non-covered pensions provide different benefits depending on the level of wages and years of employment. Thus, any adjustment that merely offsets one benefit against the other will produce inconsistent results.
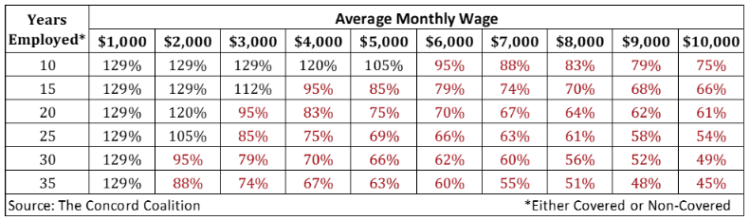
Figure 1 shows Social Security retirement benefits as a percentage of non-covered pensions for various hypothetical workers at the full retirement age (FRA).[5] Workers are assumed to have either covered or non-covered employment for the same number of years at the same level of wages. Numbers in black (>100%) indicate Social Security is greater than the non-covered pension; and numbers in red (<100%) indicate Social Security is less than the non-covered pension. Social Security’s progressive formula provides larger benefits to workers with lower wages and fewer years of employment relative to the proportional formula used by non-covered pension plans. For workers with higher wages and more years of employment, Social Security provides smaller benefits relative to non-covered pensions.
Figure 1: Social Security as a Percentage of Non-Covered Pension at FRA
Given the differences between Social Security and non-covered pensions, policymakers must recognize that no single rule can precisely achieve absolute parity. They must also consider the trade-offs between accuracy and equity when evaluating alternatives. The most frequently suggested alternative to the GPO and WEP is to compute a hypothetical Social Security benefit for non-covered workers and use that amount, instead of the non-covered pension amount, to reduce auxiliary benefits (GPO) or determine the appropriate replacement rate (WEP).[6]
Hypothetical Social Security benefits can be computed using only covered wages, only non-covered wages, or both covered and non-covered wages.[7] These approaches produce the same result when the years of covered and non-covered employment are consecutive, and the level of covered and non-covered wages is the same. However, they produce different results when the years are concurrent, or the wages are different. For example, non-covered firefighters might have covered employment before or after, but not during, their public safety career; whereas non-covered teachers might have covered employment during the summer when they are not in school.
Another alternative is to use a sliding scale formula based on the number of years of covered and non-covered employment. This approach accounts for whether average wages are low due to years with no earnings, or due to years with non-covered earnings. It also accounts for the fact that non-covered pensions are proportional, rather than progressive like Social Security.
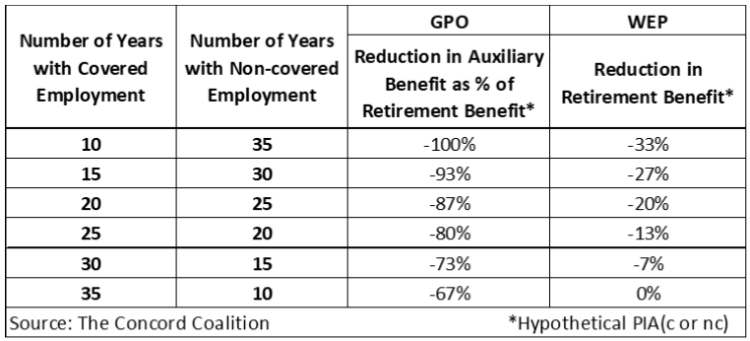
Figure 2 shows the sliding scale alternative to the GPO and WEP. Workers with 10 years of covered employment and 35 years non-covered employment would have the maximum reduction, while workers with 35 years covered and 10 years non-covered would have the minimum reduction. Proportional reductions would apply between the two extremes.
Figure 2: Sliding Scale Alternative to GPO and WEP
The Appendix compares each alternative to current law. The comparison shows the sliding scale alternative provides the most accurate and consistent results. However, these comparisons raise a fundamental question about the Social Security exemption for state and local government employees: Are benefits comparable?
Assessing Comparability of Benefits
In 1990, Congress enacted legislation making Social Security mandatory for most workers, with the most notable exception being state and local government employees.[8] This exception is limited to employees participating in a qualified pension plan that provides comparable retirement benefits. The Internal Revenue Service (IRS) issued regulations defining the “safe harbor” formulas needed to meet the definition of a qualified pension plan.[9] However, as noted in Figure 1, workers with lower wages and fewer years of employment would receive more from Social Security than from a non-covered pension plan even though it meets the safe harbor requirements.[10]
In addition, the safe harbor requirements only apply to retirement benefits, and therefore exclude auxiliary benefits for spouses and survivors, as well as disability benefits. Many non-covered pension plans do not provide full cost-of-living adjustments (COLAs). Thus, it seems likely many non-covered workers collect less from their pension than they would from Social Security.
Moreover, Social Security provides a base of financial support that should be supplemented with employer pensions and individual savings. Workers who participate in a non-covered pension plan that merely duplicates, rather than supplements Social Security, will likely have inadequate retirement income. According to various surveys, roughly two-fifths of state and local workers are employed for less than 6 years, roughly one-third are employed from 6 to 20 years, and roughly one-quarter are employed more than 20 years.[11] That means many non-covered workers will not qualify for any pension, while many others will only qualify for a reduced pension.[12]
Finally, the ability of non-covered pension plans to provide comparable benefits has been eroded in recent years by changes intended to make pensions less generous for newly hired workers to address concerns about the future solvency of their plan. Admittedly, Social Security is facing its own financial challenge, but future reforms should consider including all state and local government workers. At a minimum, the safe harbor rules should be strengthened to ensure all workers receive comparable benefits.
Conclusion
The original intent of the GPO and WEP was to ensure that workers with non-covered pensions, who qualify for Social Security, do not receive more generous benefits than workers who are only covered by Social Security. Achieving this goal is complicated by the fact that non-covered pensions provide proportional benefits in lieu of progressive Social Security benefits. Although universal Social Security coverage would resolve these issues, absent that result, a sliding scale formula would provide a more effective way to balance the competing goals of accuracy and equity between covered and non-covered workers.
* * *
Appendix – Comparing GPO and WEP Alternatives
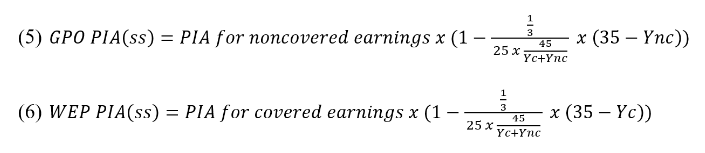
The most frequently suggested alternative to the GPO and WEP is to compute a hypothetical Social Security benefit for non-covered workers and use that amount, instead of the non-covered pension amount, to reduce auxiliary benefits (GPO) or determine the appropriate replacement rate (WEP).
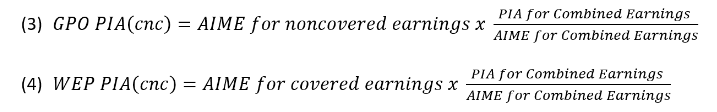
Hypothetical benefits can be computed using only covered wages (c), only non-covered wages (nc), or both covered and non-covered wages (cnc), depending on whether the alternative is intended to replace the GPO or the WEP. The formulas below illustrate this range of options. The Primary Insurance Amount (PIA) and Average Indexed Monthly Earnings (AIME) are explained in a previous issue brief.[13]
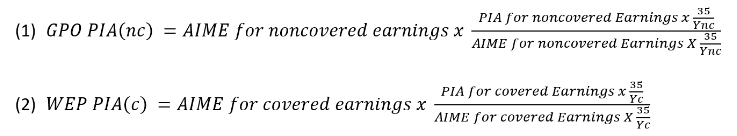
(Yc and Ync are the number of years of covered or non-covered wages, respectively, up to 35 years.)
These formulas produce the same result when the years of covered and non-covered employment are consecutive, and the level of covered and non-covered wages is the same. However, they produce different results when the years are concurrent, or wages are different.
The third alternative is to use a sliding scale (SS) formula based on the number of years of covered (Yc) and non-covered (Ync) employment.
These alternative formulas can be evaluated along two dimensions: (1) duplicating the dual entitlement rule, and (2) reducing unintended “windfall” replacement rates.
Duplicating the Dual Entitlement Rule
To duplicate the dual entitlement rule, it is necessary to determine what portion of the non-covered pension represents the Social Security benefit non-covered workers would have received if they had been covered by Social Security instead. In 2016, the Obama Administration proposed to calculate a benefit based on combined earnings (covered + non-covered) and then subtract a benefit based on covered earnings, with the remaining difference, representing the benefit based on non-covered earnings, becoming the new GPO reduction.[14] Alternatively, each of the other formulas described above could be used to calculate a hypothetical Social Security benefit based directly on non-covered earnings.
As noted in the issue brief (see Figure 1 above), the progressive Social Security formula and the proportional non-covered pension formula produce entirely different results. Replacing the GPO with an offset based on hypothetical Social Security benefits would result in larger reductions for lower wage workers and smaller reductions for higher wage workers, compared to the two-thirds reduction under current law. Thus, policymakers must consider the trade-offs between achieving parity among covered and non-covered workers versus continuing some level of redistribution from higher wage to lower wage workers.
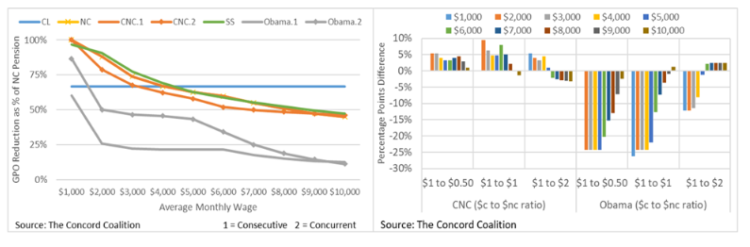
The left side of Figure A-1 shows the NC and SS alternatives produce similar results when workers have 35 years of employment, regardless of the split between covered and non-covered years. However, the SS alternative accounts for whether average wages are low due to years with no earnings, or due to years with non-covered earnings. It produces smaller reductions at every wage level when workers have fewer years of employment to avoid penalizing those with breaks in their career due to unemployment or other reasons.
The right side of Figure A-1 shows the Obama and CNC alternatives produce different results depending on the level of covered and non-covered wages and whether they were earned consecutively or concurrently. Specifically, the GPO reductions under these two alternatives would vary between workers with identical wages depending solely on whether their covered and non-covered employment occurred consecutively on concurrently.[15]
Figure A-1: Alternative GPO Reductions as Percent of Non-Covered Pension
Reducing Unintended “Windfall” Replacement Rates
Social Security replacement rates vary along two dimensions: the level of covered wages and the years of covered employment. As Figure A-2 shows, replacement rates fall as covered wages rise, and replacement rates rise as years of covered employment fall. Thus, the unintended “windfall” can be defined as the increase in replacement rates that results from replacing a year of covered employment with a year of non-covered employment.
Figure A-2: Replacement Rates at FRA by Average Monthly Wage and Years of Coverage
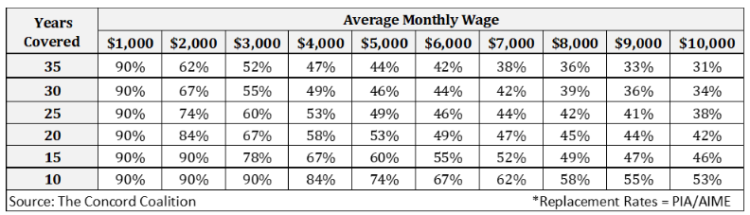
Figure A-3 shows the benefit reductions needed to make replacement rates at each level of wages and years of coverage equal to the 35-year replacement rate, thereby eliminating any unintended windfall. For example, workers earning $5,000 per month for 35 years would have a 44 percent replacement rate. To equalize replacement rates for all workers earning $5,000 per month – regardless of the number of years – benefits would need to be reduced by varying amounts ranging from 0 to 40 percent.
Figure A-3: Benefit Reductions Needed to Equal 35-Year Replacement Rate (“Parity”)
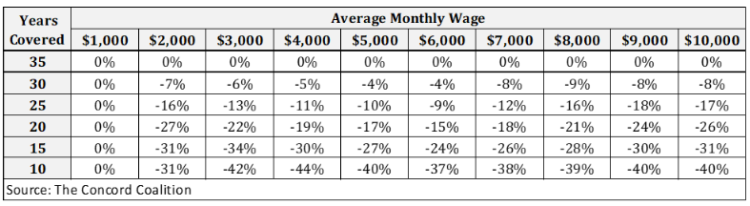
Figure A-4 compares the average benefit reductions under current law and each alternative to the average reductions in Figure A-3 (i.e., “parity”). The current WEP provision reduces benefits more than the amount needed to equalize replacement rates. The NC and CNC alternatives achieve parity when the years of covered and non-covered employment are consecutive, and the level of covered and non-covered wages is the same. However, the CNC alternative produces different results when the years are concurrent, or the wages are different.
Figure A-4: Percent Reduction in Replacement Rates Under Alternative WEP Formulas
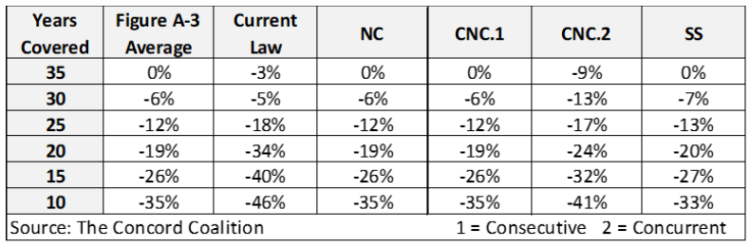
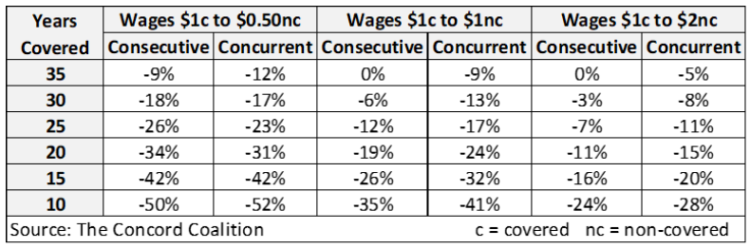
Figure A-5 provides additional analysis of the CNC alternative by varying the level of non-covered wages, relative to the level of covered wages. When non-covered wages are twice as much as covered wages ($1c to $2nc), the reductions range from 0 to 28 percent; whereas when non-covered wages are half as much as covered wages ($1c to $0.50nc) the benefit reductions range from 9 to 52 percent. These differences reflect the fact that the AIME calculation includes the highest 35 years of combined wages. Thus, when covered and non-covered wages differ, when employment occurs concurrently rather than consecutively, or when the total number of years exceeds 35, replacement rates will differ from the desired 35-year replacement rate.
Figure A-5: Benefit Reductions under the CNC Alternative when Wages are Different
The sliding scale (SS) alternative does not achieve parity as closely as the NC alternative. Unlike the NC alternative, however, the SS alternative does not reduce benefits for years in which individuals have breaks in their working career. It only reduces benefits for years in which they participated in a non-covered pension plan. A result that is likely to be considered more equitable from a social insurance perspective.
Addendum
The focus of this analysis has been on state and local government employees. However, U.S. citizens living abroad who are employed by a foreign company are also excluded from Social Security coverage.[16] Those receiving a foreign pension are subject to the WEP, but not the GPO.[17] The GPO exemption appears to be the result of an oversight in the legislative drafting, rather than explicit congressional intent.[18] It should also be noted that non-covered state and local government employees can avoid the GPO by switching to covered employment within the same retirement system for 60 months prior to their retirement.[19]
Finally, U.S. citizens living abroad who are employed by a U.S. company, or its foreign affiliate, may be subject to a totalization agreement.[20] These agreements can result in the payment of a “totalized” Social Security benefit calculated with a formula similar to the NC alternative.[21]
It’s unclear whether the SSA could obtain IRS data on the non-covered wages paid to U.S. citizens employed by foreign companies.[22] Absent this data, the SS alternative for the WEP could be applied to foreign pensions by assuming the number of years of non-covered employment is equal to 35 minus the number of years of covered employment (absence evidence to the contrary). Without non-covered employment data, the default alternative for the GPO could be two-thirds of the non-covered pension.
[2] The Social Security Un-Fairness Act? | Concord Coalition
[3] The GPO arbitrarily assumes two-thirds of the non-covered pension is equivalent to the Social Security retirement benefit that workers would have received if their non-covered earnings had been covered.
[4] Old-law Base and Year of Coverage (ssa.gov); Substantial is defined as 25% of the “old law” taxable maximum, which is $27,300 in 2022.
[5] Social Security = Primary Insurance Amount (PIA) and Non-Covered Pension = Wage x 2% x Years of Coverage
[6] The Social Security Windfall Elimination Provision: Issues and Replacement Alternatives (ssa.gov); The Windfall Elimination Provision (WEP) in Social Security: Comparing Current Law with Proposed Proportional Formulas (congress.gov); Congressional Testimony | Social Security Subcommittee | GPO and WEP | (ssa.gov)
[7] Social Security Administration’s Master Earnings File (ssa.gov); SSA did not collect non-covered earnings data prior to 1978.
[8] Public Law 101-508, STATUTE-104-Pg1388.pdf (congress.gov); IF11824 (congress.gov)
[9] Publication 963 (Rev. 7-2020) (irs.gov)
[10] The results would depend on the vesting period, final average salary (FAS) rule, benefit multiplier, and age-earnings profile under each system.
[13] Social Security Replacement Rates: “Nudging” in the Wrong Direction? | Concord Coalition; See Appendix
[14] Congressional Testimony | Social Security Subcommittee | GPO and WEP | (ssa.gov)
[15] Percentage points difference is calculated as (NC Pension / PIAnc consecutive) – (NC Pension / PIAnc concurrent) for each combination of covered and non-covered wages: $1 to $0.50, $1 to $1, and $1 to $2.
[16] Persons Employed by a Foreign Employer | Internal Revenue Service (irs.gov)
[17] SSA – POMS: GN 00307.290 – Evidence of Foreign Pensions and the Windfall Elimination Provision (WEP); SSA – POMS: GN 02608.100 – Government Pension Offset (GPO) Provision
[18] Social Security Act §202 (ssa.gov) 202(k)(5); Social Security Act §215 (ssa.gov), 215(a)(7)
[19] SSA – POMS: GN 02608.107 – Exemption for Last 60 Months of Employment Covered Under Social Security; Revision to the Government Pension Offset Exemption Should Be Reconsidered | U.S. GAO
[20] International Social Security Agreements (congress.gov)
[21] The Social Security Windfall Elimination Provision: Issues and Replacement Alternatives (ssa.gov);
Continue Reading